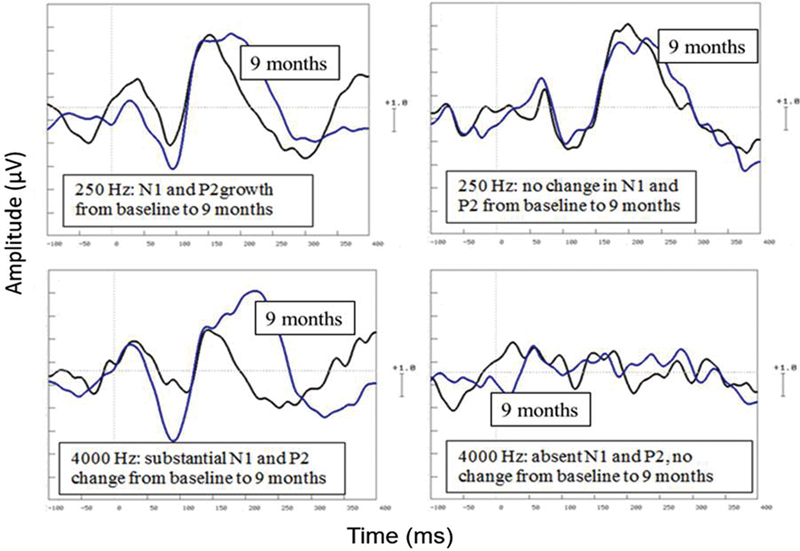
Figure 3.

Individual cortical auditory evoked potential waveforms to 250 Hz (top) and 4,000 Hz (bottom) tones showing different patterns of results, comparing baseline recordings at the time of CI activation to recordings at 9 months (labeled). The x-axis shows time in milliseconds (from −100 to +400 milliseconds). The y-axis shows voltage in microvolts (1 scale unit = 1 μV).
