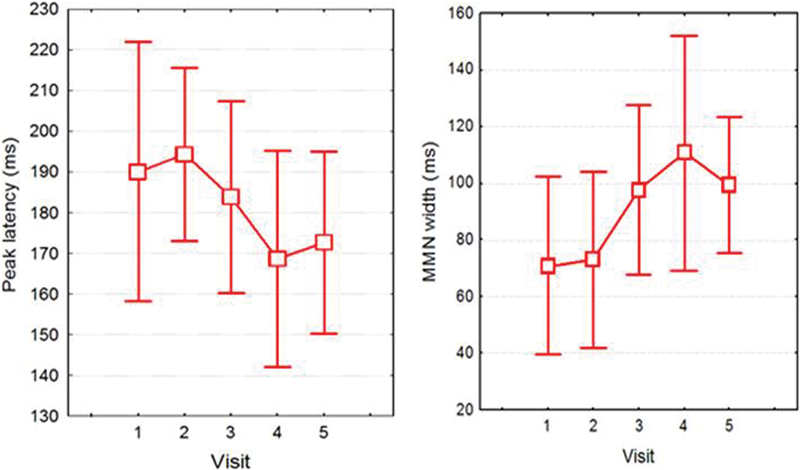
Figure 7.

Average mismatch negativity (MMN) latencies (left) and width (right; both in milliseconds) recorded at baseline (CI activation) and 1, 3, 6, and 9 months postimplantation (visits 1, 2, 3, 4, 5, respectively). Error bars indicate 95% confidence intervals.
