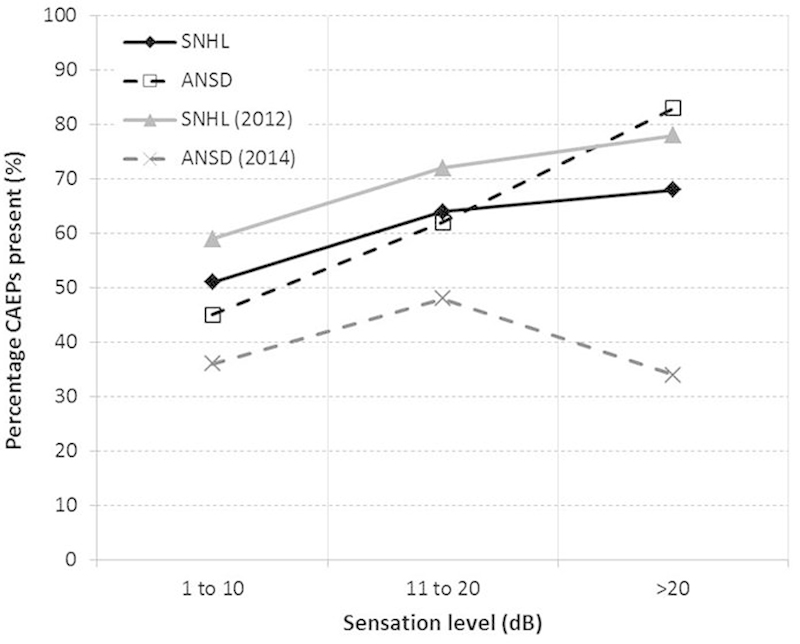
Figure 3.

Percentage of cortical auditory evoked potentials (CAEPs) present for three ranges of estimated sensation level. Filled diamonds depict data for 29 infants with sensory/neural hearing loss (SNHL; 243 CAEP measures), and open squares show data for 17 infants with auditory neuropathy spectrum disorder (ANSD; 98 CAEP measures) from the current study. Filled triangles depict data for 22 infants (81 CAEP measures) reported in Van Dun et al.16 Crosses depict data from 12 infants with ANSD (72 CAEP measures) reported in Gardner-Berry et al.17
