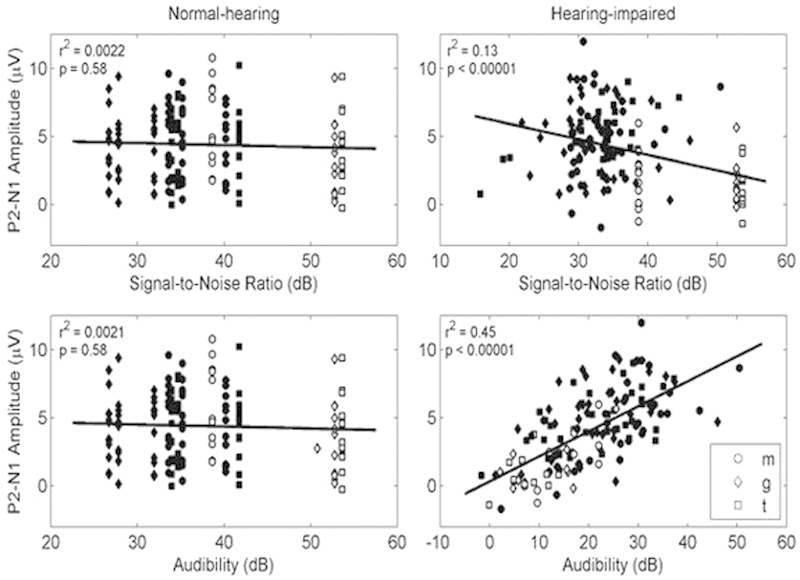
Figure 5.

Scatterplots of cortical auditory evoked potential cortical auditory evoked potential mean amplitude versus signal-to-noise ratio and audibility, for normal-hearing and hearing-impaired participants. In both aided (closed markers) and unaided (open markers) conditions, only a 55 dB sound pressure level input level is shown. Abbreviations: N1, negative peak around 100 milliseconds; P2, positive wave.
