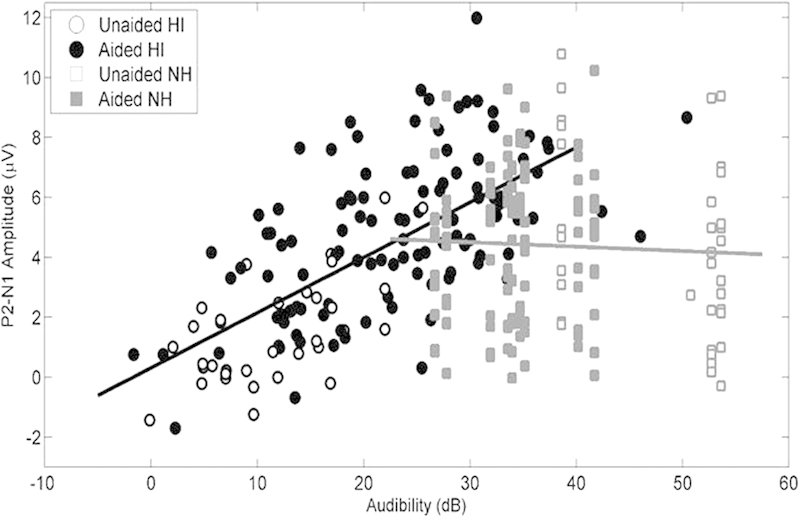
Figure 6.

Scatterplot of P2-N1 mean amplitude versus audibility for both aided (closed markers) and unaided (open markers) conditions, and regression lines fitted to the data from each group of participants (black: hearing-impaired; gray: normal-hearing). Abbreviations: HI, hearing-impaired subjects; N1, negative peak around 100 milliseconds; NH, normal-hearing subjects; P2, positive wave around 180 milliseconds.
