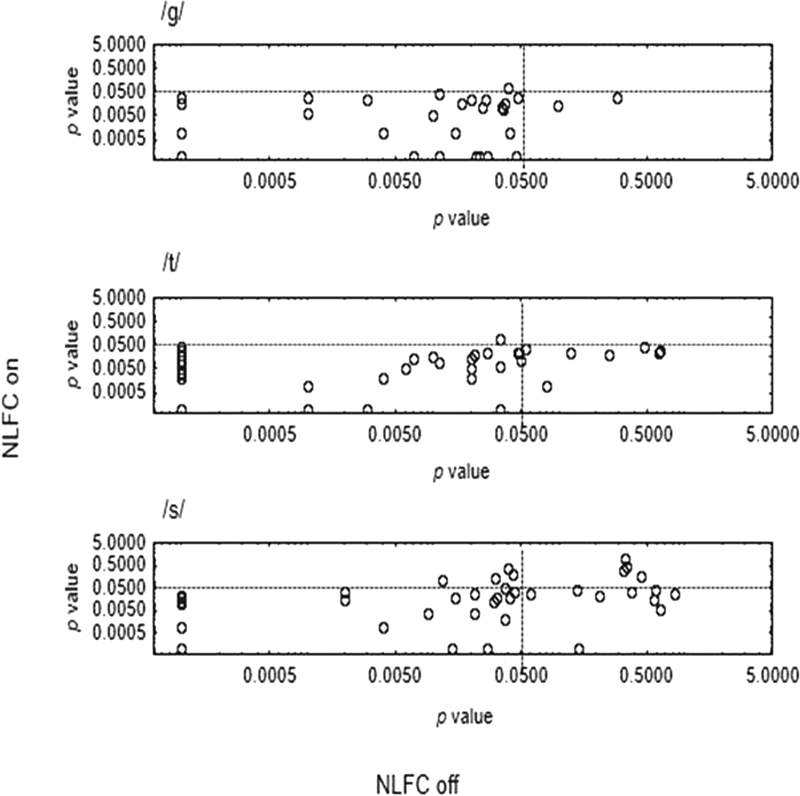
Figure 4.

Probability level (p value) of measurements of cortical auditory evoked potentials when nonlinear frequency compression (NLFC) was on (y-axis) versus p value when NLFC was off (x-axis), separately for each stimulus (/g/, /t/, /s/ from top to bottom panels). In each panel, data points in the bottom left quadrant depict measurements that were significant (p < 0.05) in both NLFC conditions. Those in the top left quadrant depict measures that were significant when NLFC was off, but not when it was on. The top right quadrant shows measurements that were not significant irrespective of whether NLFC was activated. The bottom right quadrant depicts measurements that were significant when NLFC was on that were not significant when it was off.
