
Figure 3.
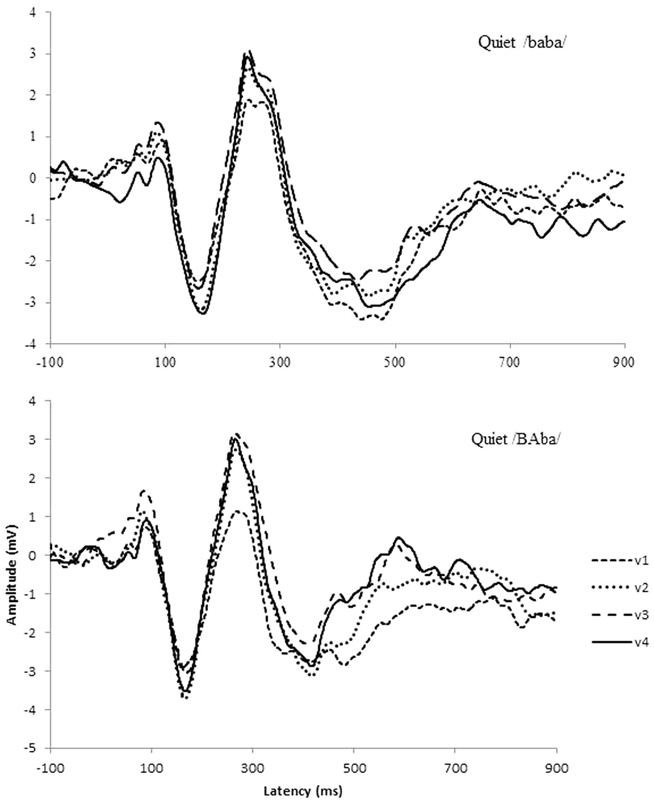
Cortical auditory evoked potential grand averages showing changes in the average waveform over visits, with v1, v2, and v3 being pretraining visits and v4 being the post-training visit. Top graph shows quiet /baba/ and bottom graph shows quiet /BAba/ condition.