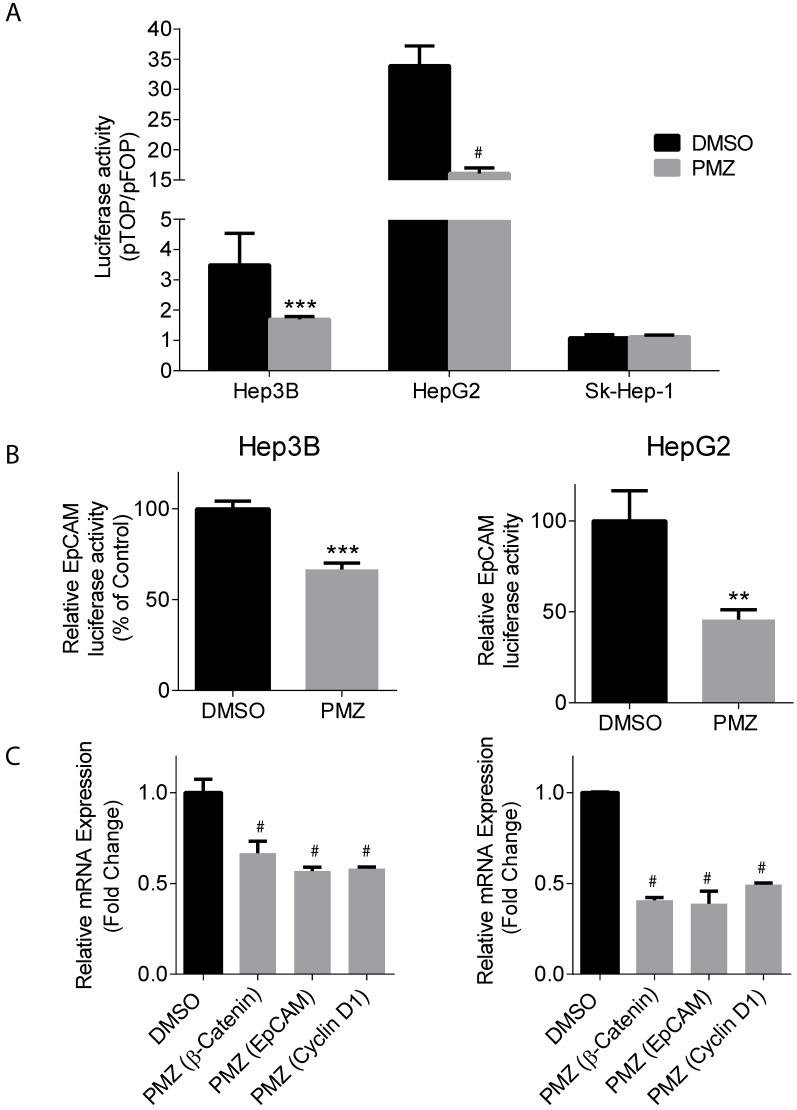
Figure 3.
Pimozide decreases transcriptional activity and gene expression of β-catenin and wnt/ β-catenin signaling targets. (A) Representative bar-graphs showing reduction of β-catenin transcriptional activity, as measured by pTOP/pFOP luciferase assay, in Hep3B, HepG2 and Sk-Hep-1 cells following DMSO (black bars) or PMZ treatment (gray bars). (B) Representative bar-graphs showing reduction of EpCAM transcriptional activity, as measured by luciferase assay, in Hep3B (left panel) and HepG2 cells (right panel), following DMSO (black bars) or PMZ (gray bars) treatment. (C) Representative bar-graphs showing reduction of mRNA expression in Hep3B (left panel) and HepG2 cells (right panel), as measured by qRT-PCR, in β-catenin, EpCAM and Cyclin D1 following DMSO (black bars) or PMZ (gray bars) treatment. Error bars represent ± SD, with at least triplicate determinations per point. ** p<0.01, *** p<0.001, # p<0.0001.

