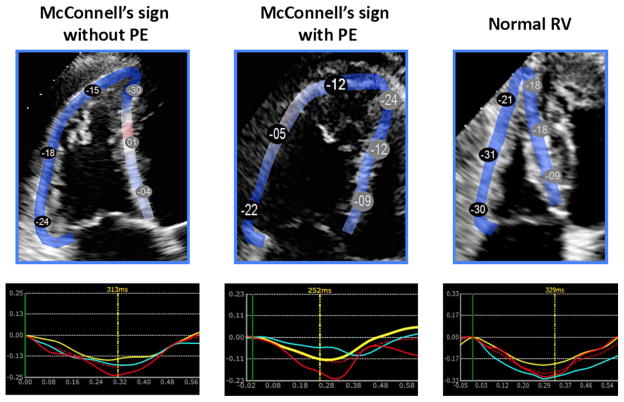
Figure 2.
Right ventricular free wall longitudinal strain measurements in two patients with McConnell’s sign: one without pulmonary embolism (left) and the other with pulmonary embolism (middle), and in a normal subject (right), along with the corresponding free wall segmental strain curves (bottom). Note the differences in the magnitude of the segmental peak strain among the three patients (see text for details).

