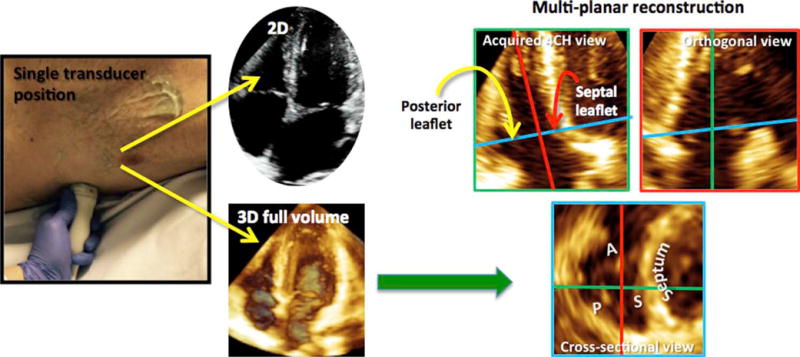
Figure 2.

To determine which leaflets were being imaged in the 2D view, 2D and 3D full-volume data sets were obtained with the transducer probe in the same position on the chest wall (left). The full-volume data set was analyzed using MPR (right). The green plane (top left) represented the original 2D input. The position of this plane was not adjusted. The red (orthogonal) and blue (cross-sectional) planes were adjusted to depict a cross-section of the TV as viewed from the RV perspective (blue plane). The leaflets seen in the original 2D imaging plane could then be determined by studying the intersection between the green plane and the cross-sectional plane.
