
Figure 3.
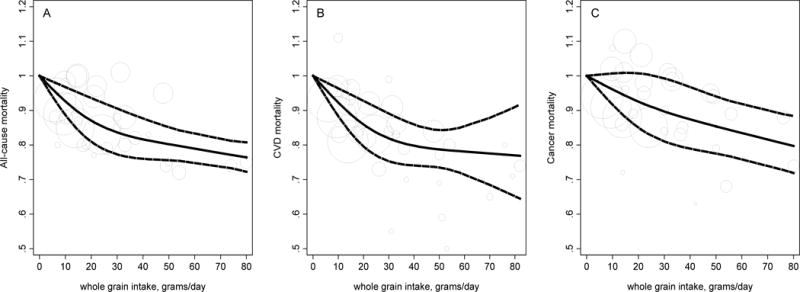
Dose-response analysis for associations between whole grain intake and mortality. All-cause (A; Ptrend<0.001, Pnonlinearity=0.06), CVD (B; Ptrend<0.001, Pnonlinearity=0.10), and cancer (C; Ptrend<0.001, P nonlinearity=0.67) mortality in prospective cohort studies. The pooled linear risk trend (thick solid line) and its 95% CI (thick dashed lines) were obtained by a random-effects dose-response meta-analysis. Circles are inversely proportional to the variance of log relative risks.