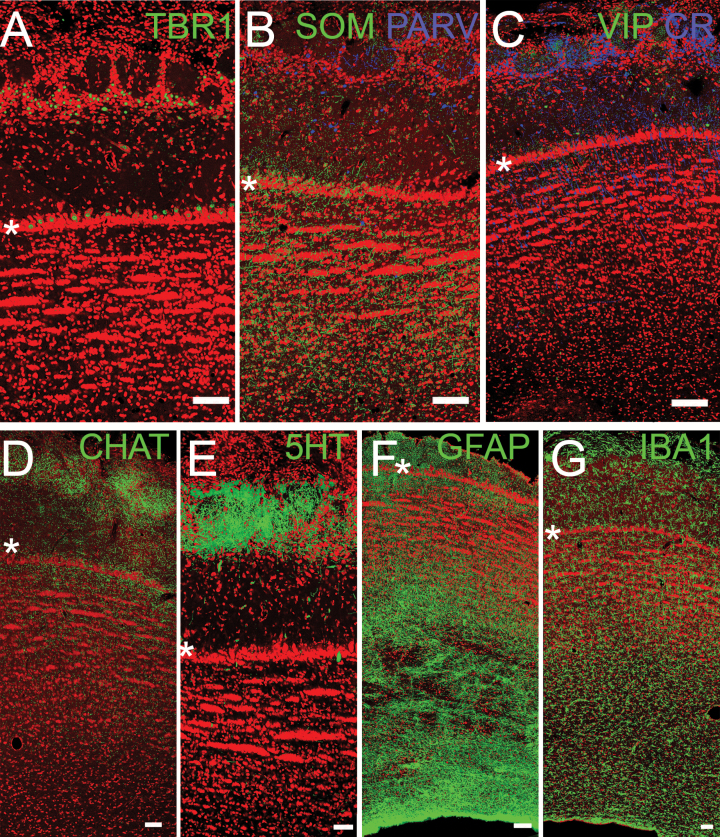
Figure 3.
Confocal images of OB. Asterisks delineate the MCL for orientation (Figure 2B). (A) TBR1 staining (green) labels projection neurons: mitral and tufted cells. (B, C) Interneurons stained for SOM, PARV, VIP, and CR. (D, E) Neuromodulatory inputs from higher brain regions, including cholinergic (CHAT) and serotonergic (5-HT) fibers. (F, G) Glial cells including astrocytes (GFAP) and microglia (IBA-1). Red = Nissl stain. Scale bars = 100µm

