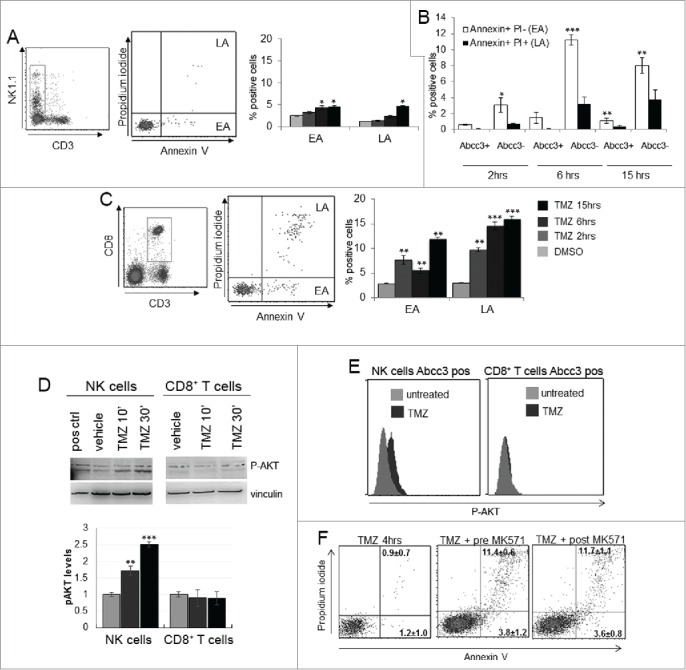
Figure 3.

NK cells exhibit resistance to TMZ-induced apoptosis. (A and C) Apoptosis induced by TMZ treatment in NK and CD8+ T cells from PBLs of naive mice (n = 20). EA and LA represent early and late apoptosis, respectively. (B) Early and late apoptosis of Abcc3+ and Abcc3− NK cells treated in vitro with 1 μM TMZ. (D) Western blot analysis and densitometric quantification of pAkt in blood immune-separated NK and CD8+ T cells of naïve mice (n = 20) treated with 1 μM TMZ or DMSO. (E) Intracellular staining of pAkt in blood-derived Abcc3+NK and Abcc3+CD8+ T cells from glioma-bearing mice (n = 4/group) at 72 h. (F) Representative dot plots showing apoptosis in NK cells treated for 4 h in vitro with 1 μM TMZ and 25 μM Abcc3 inhibitor added to the medium 30 min before (pre-MK571) or after (post MK571) the pharmacological treatment. *p < 0.01, **p < 0.001 and ***p < 0.0001.
