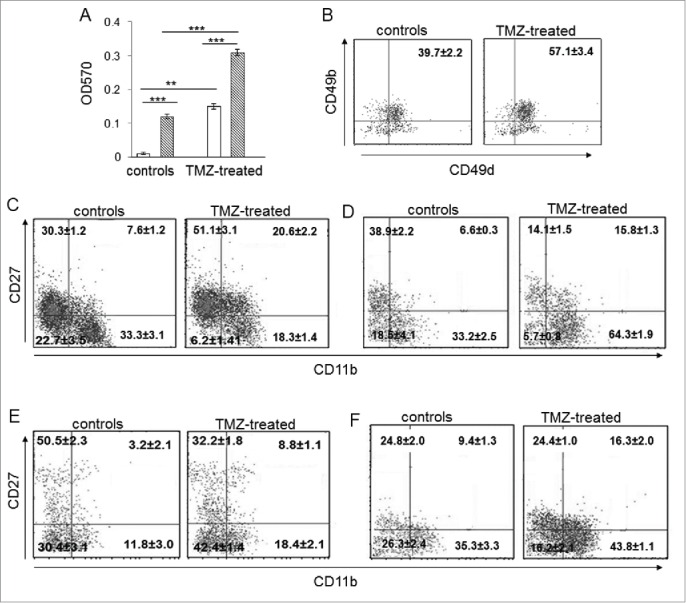
Figure 4.

The developmental stage of NK cells from TMZ-treated mice was influenced by TMZ. (A) Migration of NK cells from PBLs of TMZ-treated and control mice (n = 30/group) at 72 h toward medium from DMSO-treated (white bars) and TMZ-treated (striped bars) GL261 cells. **p < 0.005; ***p < 0.0001. (B) CD49b and CD49d integrin surface expression in blood-derived NK cells from TMZ-treated and control mice (n = 4/group) isolated at 72 h; p < 0.001. (C and D) Representative dot plots of the NK cell four-developmental stages basing on surface expression of CD27 and CD11b in blood of TMZ- and vehicle-treated mice on days 12 (C) and 19 (D); p < 0.01. (E and F) Representative dot plots showing CD27 and CD11b expression in tumor-infiltrating NK cells isolated on day 12 (E) and 19 (F) from gliomas, p < 0.005.
