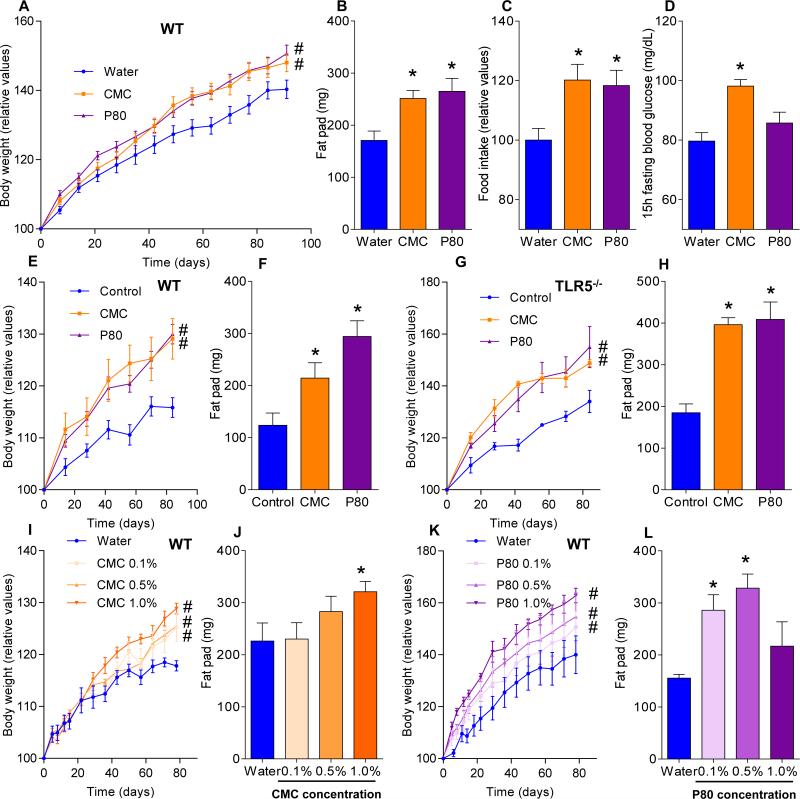
Figure 3. Dietary emulsifiers promote metabolic syndrome.
(A-D) WT Mice were exposed to drinking water containing CMC or P80 (1.0%) for 12 weeks. (A) Body weight over time, (B) fatpad mass, (C) food intake, and (D) 15-hours fasting blood glucose concentration. (E-F) WT and (G-H) TLR5−/− mice were given mouse chow containing CMC or P80 (1.0%) for 12 weeks. (E, G) Body weights over time, (F, H) fat-pad mass. WT mice were exposed to drinking water containing 0.1-1.0% CMC (I-J) or P80 (K-L) for 12 weeks. (I, K) Body weight over time, (J, L) fat-pad mass. Data are the means +/- S.E.M. (n=20 for A-D, n=5 for E-L). Significance was determined using one-way ANOVA corrected for multiple comparisons with Sidak test (* indicates p<0.05) or 2-way group ANOVA corrected for multiple comparisons with Bonferroni test (# indicates p<0.05) compared to control group.

