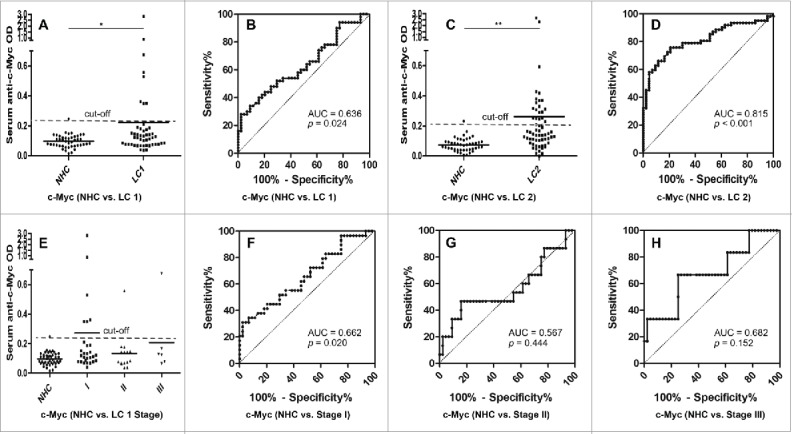
Figure 4.

Serum anti-c-Myc autoantibodies in lung cancer patients and NHC. In Fig 4A, 4C and 4E, Y-axis represents OD value and X-axis represents serum samples (*p < 0.05; **p < 0.01). (A) Serum anti-c-Myc autoantibodies distribution in NHC (n = 44) and lung cancer patients (n = 50) (p = 0.049). (B) ROC curve analysis using serum anti-c-Myc autoantibodies for discriminating lung cancer patients from NHC in research group (AUC: 0.636, 95% CI: 0.524–0.747, p = 0.024). (C) Serum anti-c-Myc autoantibodies distribution in the validation group including NHC (n = 43) and lung cancer patients (n = 62) (p = 0.001). (D) ROC curve yielded by OD values of serum anti-c-Myc autoantibodies for discriminating lung cancer patients from NHC in the validation group (AUC: 0.815, 95% CI: 0.733–0.896, p < 0.001). (E) Serum anti-c-Myc autoantibodies distribution and in NHC and lung cancer patients with different TNM stage. (F) ROC curve yielded by OD values of anti-c-Myc autoantibodies in discriminating stage I lung cancer patients from NHC (AUC: 0.662; 95% CI: 0.532–0.791, p = 0.020). (G) ROC curve yielded by OD values of anti-c-Myc autoantibodies in discriminating stage II lung cancer patients from NHC (AUC: 0.567; 95% CI: 0.377–0.756, p = 0.444). (H) ROC curve yielded by OD values of anti-c-Myc autoantibodies in discriminating stage I lung cancer patients from NHC (AUC: 0.682; 95% CI: 0.439–0.924, p = 0.152). Note: LC1: 50 lung cancer patients from research group. LC2: 62 lung cancer patients from validation group.
