Figure 4.

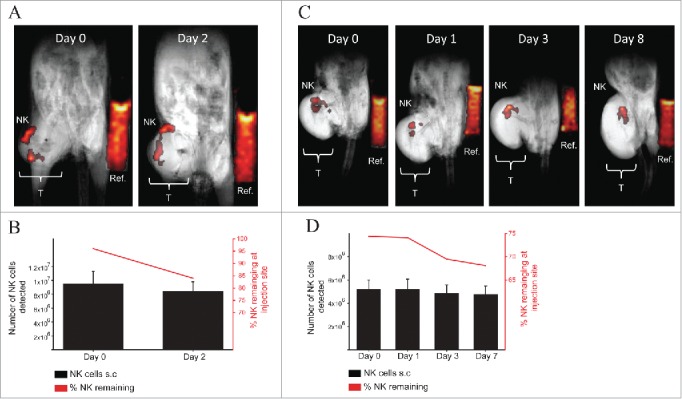
MRI in vivo detection of 19F-labeled human NK cells in NSG mice bearing xenograft human tumors. (A–B) 10 × 106 19F-labeled (4 mg/mL PFPE for 24 h) human NK cells were injected intratumor into one NSG mouse bearing a human neuroblastoma (CHLA-20) on the right flank (T: Tumor). 19F intensity from NK cells or from the reference (Ref: Reference vial of 19F) vial is displayed on a “hot-iron” scale. Mouse was imaged for 1H and 19F by MRI using a volumetric coil and anesthetized using ketamine and xylazine. (A) Composite 19F/1H images at 0 or 2 d post NK cell injection are shown with 32 min and 42 min of scan time for each day respectively. (B) The number (black bars corresponds to left y-axis) and percentage (red line graph corresponds to the right y-axis) of NK detected in the tumor is denoted and was determined based on the efficiency of 19F uptake by NK cells from NMR analysis. (C–D) 7 × 10⁶ 19F-labeled (4 mg/mL PFPE for 24 h) NK cells were injected intratumor into one NSG mouse bearing a human mantle cell lymphoma (Z138) on the right flank. (C) Imaging for 1H and 19F was established as described in (A) with scan time of 42 min for each time point. (D) Number (black bars corresponds to left y-axis) and percentage (red line graph corresponds to the right y-axis) of NK cells detected at the tumor site is denoted for each imaging time point. Values represent the mean ± SEM of one single experiment. The uncertainty in the 19F reference mean signal () was estimated as the standard deviation of the ROI drawn on the reference (see methods for quantification of 19F signal).
