
Figure 5.
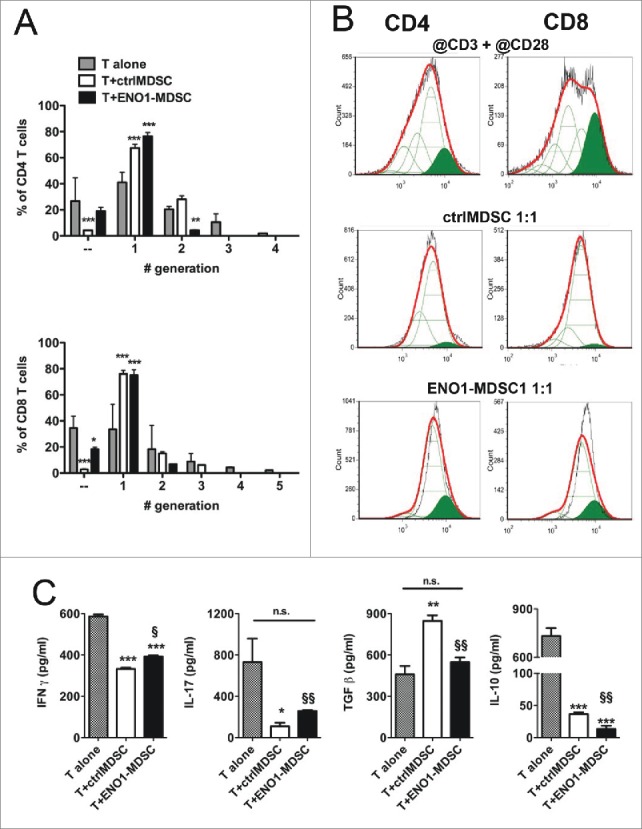
Suppressive function of MDSC after ENO1-treatment. (A) The suppressive function of MDSC was measured using 1 × 10⁶ Cytotrack Red-labeled anti-CD3 plus anti-CD28 mAbs activated lymph node cells, either cultured or not cultured (gray bars) with ctrl- (white bars) or ENO1-MDSC (black bars). Cytotrack Red dilution in both CD4+ and CD8+ T cells was evaluated by flow cytometry. Graphs represent the mean ± SEM of percentage of CD4+ (upper panel) and CD8+ (lower panel) T cells in each generation, as evaluated from the histogram analysis shown in Panel B. *, **, ***p values < 0.05, 0.001 and 0.0001 significantly discriminate ctrl- from ENO1-MDSC. (B) Lymph node cells collected after 72 h of co-culture were stained and gated for CD4+ (left panels) and CD8+ (right panels) expression. Green peaks represent the non-dividing population, empty peaks indicate the different generations due to the vital dye dilution and the red line is the fitting curve evaluated by the FCSExpress 5 Software. For the analysis, a ratio of 0.5 between each generation was set. Representative results from two independent experiments are shown. (C) Supernatants from lymph node cells and ctrl- or ENO1-MDSC co-cultures were analyzed for the presence of IFNγ, IL-17, Il-10 and TGF-β. Graphs represent the mean ± SEM of values obtained from three independent experiments. *, **, ***p values < 0.05, 0.001 and 0.0001, which significantly discriminate activated T cells alone from those co-cultured with ctrlMDSC and ENO1-MDSC. §, §§p values < 0.05 and 0.001, which significantly discriminate T cells co-cultured with ctrlMDSC from T cells co-cultured with ENO1-MDSC.