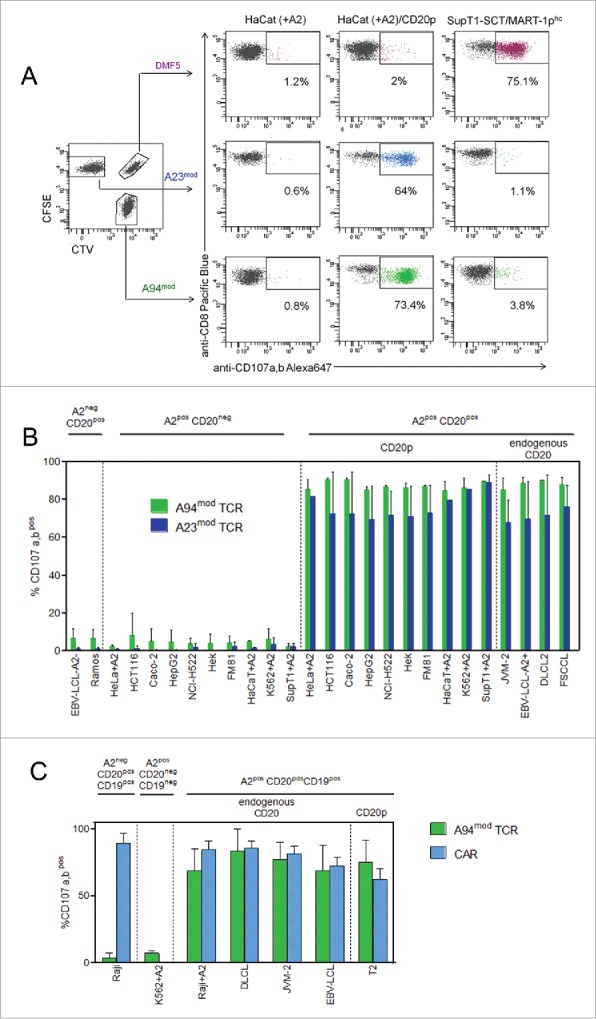
Figure 2.

CTLs re-directed with CD20p/HLA-A2-reactive TCR display exquisite antigen specificity and mediate similar degranulation responses to antigen-positive target cells as CD19 CAR-transduced T cells. (A) PBMC from one donor were retrovirally transduced with three different TCRs and expanded. Each TCR-transduced population was subsequently color-coded to allow identification by flow cytometry; A94mod CTLs with CTV, A23mod CTLs with CFSE and DMF5 CTLs with CTV/CFSE, and combined into one sample, as shown in the left dot plot, gated on CD8pos T cells. Degranulation responses (mobilization of CD107a,b) were measured in the CTLs following incubation with indicated target cells; HaCaT cells transfected with HLA-A2 mRNA (+A2), either loaded or not with CD20 peptide, and SupT1 cells induced to express SCT/MART-1phc. (B) Summary of degranulation responses measured in T cells expressing A94mod or A23mod that were treated and analyzed as described in A following incubation with a panel of target cells (left to right); two HLA-A2negCD20pos B cell lines, 10 different HLA-A2posCD20neg cell lines of various tissue origins in the absence or presence of externally loaded peptide (CD20p), and four HLA-A2pos B-cell lines endogenously expressing CD20. HLA-A2 (A2pos) was either naturally expressed or induced (+A2), as indicated. Bars represent mean frequencies of CD107a,bpos events among stimulated CD8pos CTLs following subtraction of values for CTLs alone. Error bars indicate SD of duplicate samples from n = 3 experiments for all conditions, except for CD20p (n = 4) and CD20 mRNA (n = 2). The p values were calculated using Student’s t-test (one star p < 0.05; two stars p < 0.01; three stars p < 0.001). (C) Degranulation of expanded PBMCs retrovirally transduced with A94mod or a CD19 CAR was measured following co-incubation with indicated target cell lines: Raji (HLA-A2negCD20posCD19pos); K562 transduced with HLA-A2 (HLA-A2posCD20negCD19neg); or HLA-A2pos cell lines endogenously expressing CD19 and CD20 (Raji+A2 (transduced with HLA-A2), DLCL, JVM-2, HLA-A2pos EBV-LCL), or expressing CD19 and loaded with CD20p (T2 cells), as indicated. Bars represent mean frequencies of CD107a,bpos events among CD8pos CTLs following subtraction of values for CTLs alone and normalized according to the transduction efficiency. Error bars indicate SD of triplicate samples from n = 3 experiments for JVM-2, Raji and T2; n = 2 experiments for DLCL, Raji+A2 and EBV-LCL; n = 1 for K562+A2.
