
Figure 7.
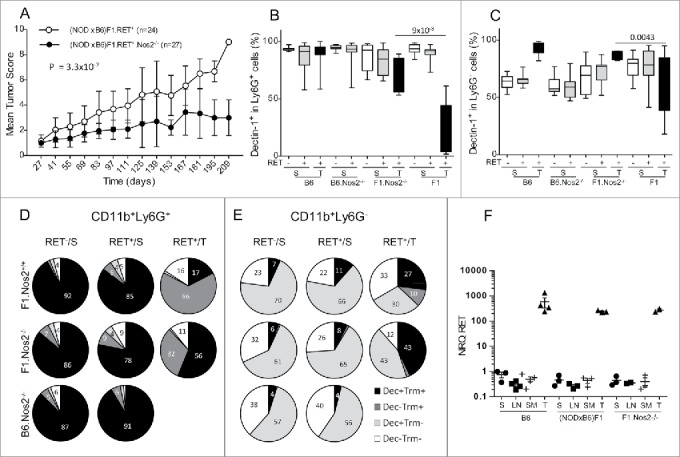
Less severe tumor evolution and upregulation of Dectin-1 expression in (NODxB6)F1.RET+.Nos2−/− mice. Hybrid (NODxB6)F1.RET+ transgenic mice proficient (open circles, n = 24) or deficient (dark circles, n = 27) for the Nos2 gene were monitored for tumor development every other week for 7 mo. The mean tumor score and its standard deviation are shown at each timepoint. The difference of tumor scores between both groups was tested using a linear model with mixed effects. (B, C) Upregulation of Dectin-1 expression on CD11b+Ly6G+ (B) and CD11b+Ly6G− (C) myeloid cells in spleen (S) and tumors (T) of (NODxB6)F1 and B6.RET+ mice deficient for Nos2 compared with their Nos2+/+ counterparts. (D, E) Dectin-1/Trem-1 double labeling of myeloid subsets in spleens and tumors. CD11b+Ly6G+ (D) and CD11b+Ly6G− (E) cells were gated electronically and the percentages of cell subsets defined by Dectin-1/Trem-1 double labeling were determined in mice with indicated genetic background and are depicted using pie charts. Dec, Dectin-1; Trm, Trem-1. (F) Quantification by qPCR of RET transgene expression in tumors (T) and in lymphoid organs, including spleen (S), peripheral lymph nodes (LN) and submandibular lymph nodes (SM), of RET+ mice with indicated genetic background. Normalized relative quantities (NRQ) of RET messages were determined as described in Materials and Methods. Number of samples per group: B6.RET− S, n = 8; B6.RET+ S, n = 17; B6.RET+ T, n = 12; B6.Nos2−/−.RET− S, n = 7; B6.Nos2−/−.RET+ S, n = 12; F1.Nos2−/−.RET− S, n = 17; F1.Nos2−/−.RET+ S, n = 16; F1.Nos2−/−.RET+ T, n = 4; F1.RET− S, n = 11; F1.RET+ S, n = 14; F1.RET+ T, n = 10.