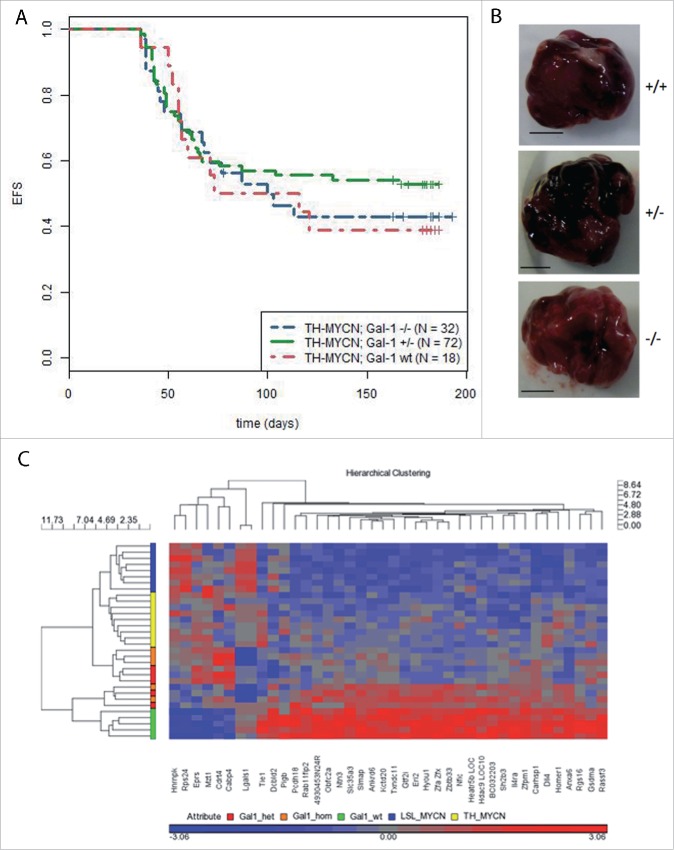
Figure 2.
(A) Kaplan–Meier survival analyses of TH-MYCN mice depending on Gal-1 gene dosage. Time to detection of a palpable tumor was defined as event-free survival (EFS) and is shown for TH-MYCN/Gal-1wt/wt (red curve), TH-MYCN/Gal-1wt/– (green curve) and TH-MYCN/Gal-1−/− mice (blue curve). (B) Macroscopically, no differences were detectable between tumors with different Gal-1 genotypes (+/+: TH-MYCN/Gal-1wt/wt, +/−: TH-MYCN/Gal-1wt/–, –/–: TH-MYCN/Gal-1−/−). (C) Expression profiling of tumors revealed no global differences in the transcriptomes of TH-MYCN tumors with different Gal-1 genotypes. Note that the most prominent change on mRNA levels affects the coding gene for Gal-1, LGALS1.

