
Fig. 1. Transcriptome variation among human populations.
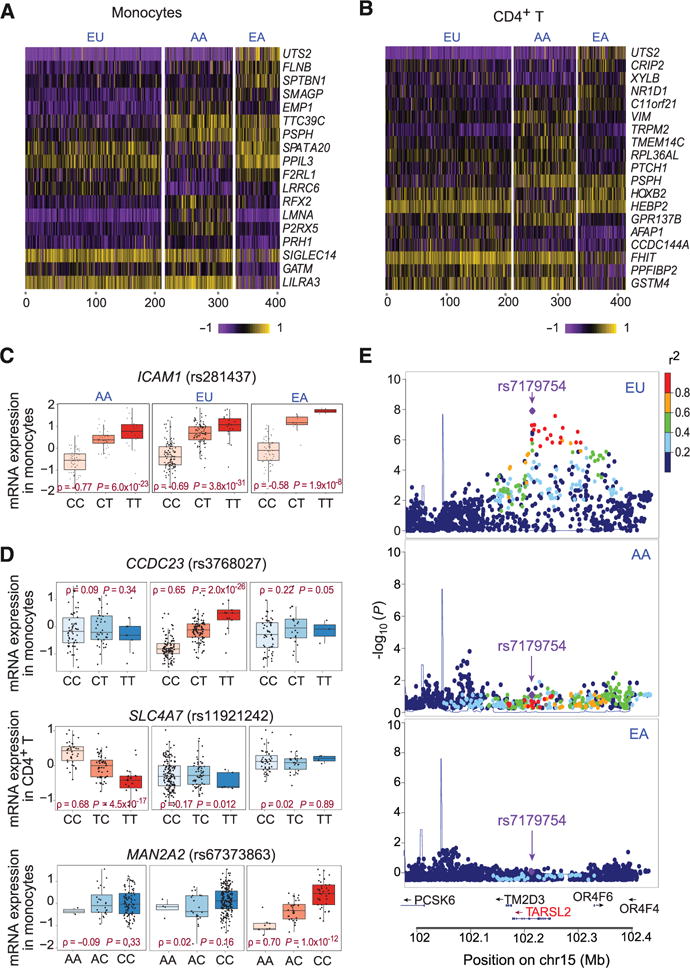
Heat map of genes that are differentially expressed (VST > 0.2) in monocytes (A) and T cells (B). (C) Example of a cis-eQTL shared across populations. (D) Examples of population-specific cis-eQTLs. (E) Regional association plots of an EU-specific cis-eQTL in the TARSL2 locus.