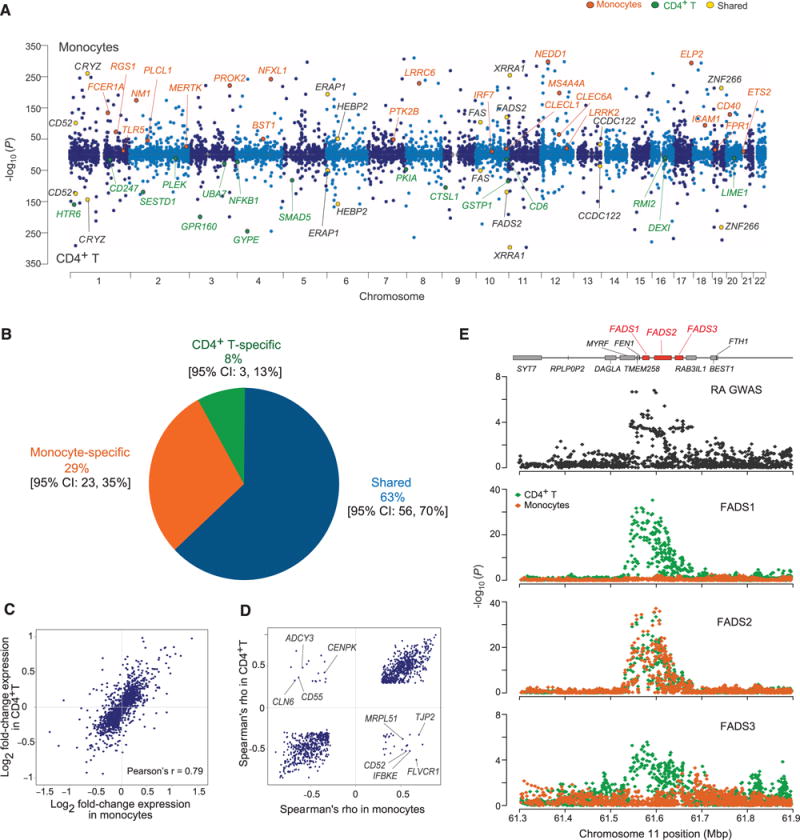
Fig. 2. Comparison of meta-analysis results from each cell type.

(A) Manhattan plots of the most significant cis-eQTL per gene in monocytes (top) and T cells (bottom). The highlighted genes are representative of genes that (i) are shared, (ii) are cell-specific, or (iii) overlap with a disease association. (B) Inference of the proportion of cis-eQTL sharing between the two cell types using a Bayesian hierarchical model. (C) Expression-level fold-change for the most significant cis-eQTLs in T cells and monocytes. (D) Spearman’s ρ (direction of allelic effect on gene expression) for the most significant cis-eQTLs shared by the two cell types. We highlight genes that have discrepant directions of effect. (E) Example of a context-specific cis-eQTL in a rheumatoid arthritis locus. Mbp, megabase pairs.
