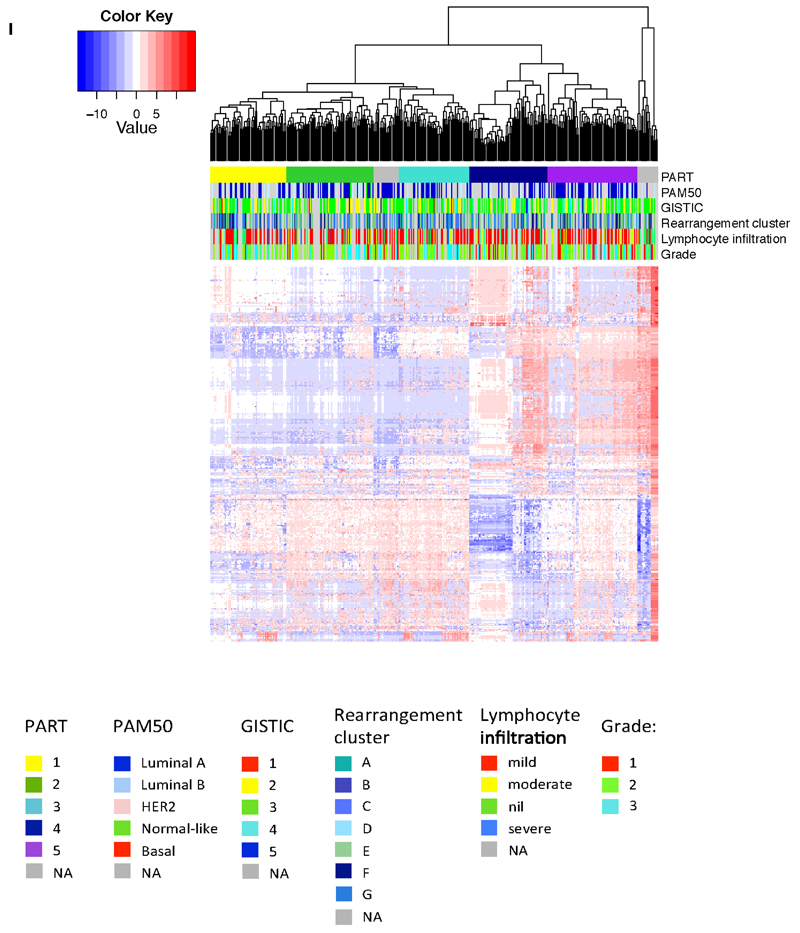
Extended Data Figure 5. miRNA analyses.
Hierarchical clustering of the most variant miRNAs using complete linkage and Euclidean distance. miRNA clusters were assigned using the Partitioning Algorithm using Recursive Thresholding (PART) method. Five main patient clusters were revealed. The horizontal annotation bars show (from top to bottom): PART cluster group, PAM50 mRNA expression subtype, GISTIC cluster, rearrangement cluster, lymphocyte infiltration score and histological grade. The heatmap shows clustered and centered miRNA expression data (log2 transformed). Details on colour coding of the annotation bars are presented below the heatmap.

