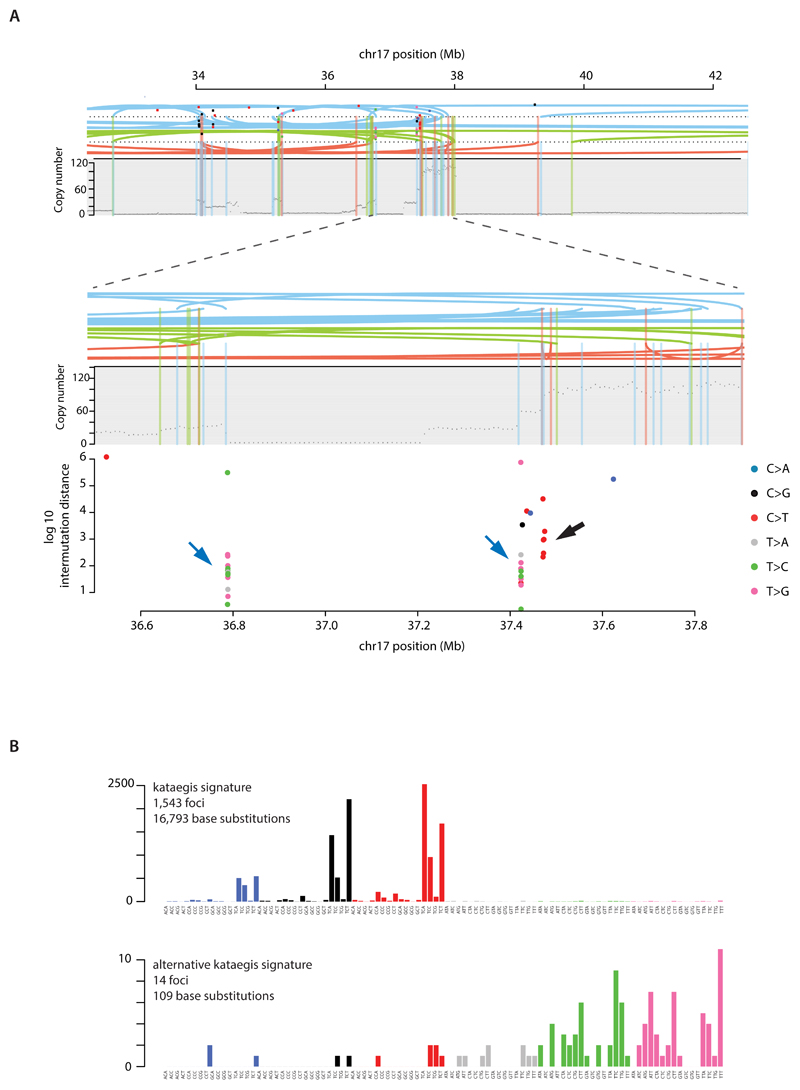
Extended Data Figure 10. Signatures of focal hypermutation.
(A) Kataegis and alternative kataegis occurring at the same locus (ERBB2 amplicon in PD13164a). Copy number (y-axis) depicted as black dots. Lines represent rearrangements breakpoints (green=tandem duplications, pink=deletions, blue=inversions). Topmost panel showing a ~10Mb region including the ERBB2 locus. Second panel from top zooms in 10-fold to a ~1Mb window highlighting co-occurrence of rearrangement breakpoints, with copy number changes and three different kataegis loci. Third panel from top demonstrates kataegis loci in more detail. Log10 intermutation distance on y axis. Black arrow highlighting kataegis. Blue arrows highlighting alternative kataegis.
(B) Sequence context of kataegis and alternative kataegis identified in this dataset.

