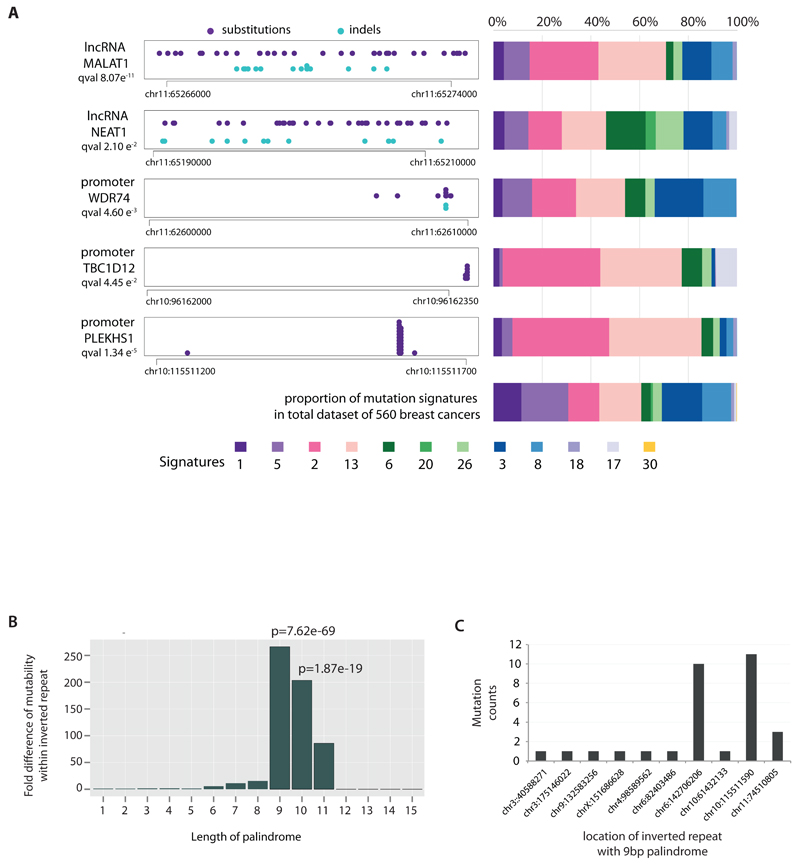
Figure 2. Non-coding analyses of breast cancer genomes.
(A) Distributions of substitution (purple dots) and indel (blue dots) mutations within the footprint of five regulatory regions identified as being more significantly mutated than expected is provided on the left. The proportion of base substitution mutation signatures associated with corresponding samples carrying mutations in each of these non-coding regions, is displayed on the right.
(B) Mutability of TGAACA/TGTTCA motifs within inverted repeats of varying flanking palindromic sequence length compared to motifs not within an inverted repeat.
(C) Variation in mutability between loci of TGAACA/TGTTCA inverted repeats with 9bp palindromes.

