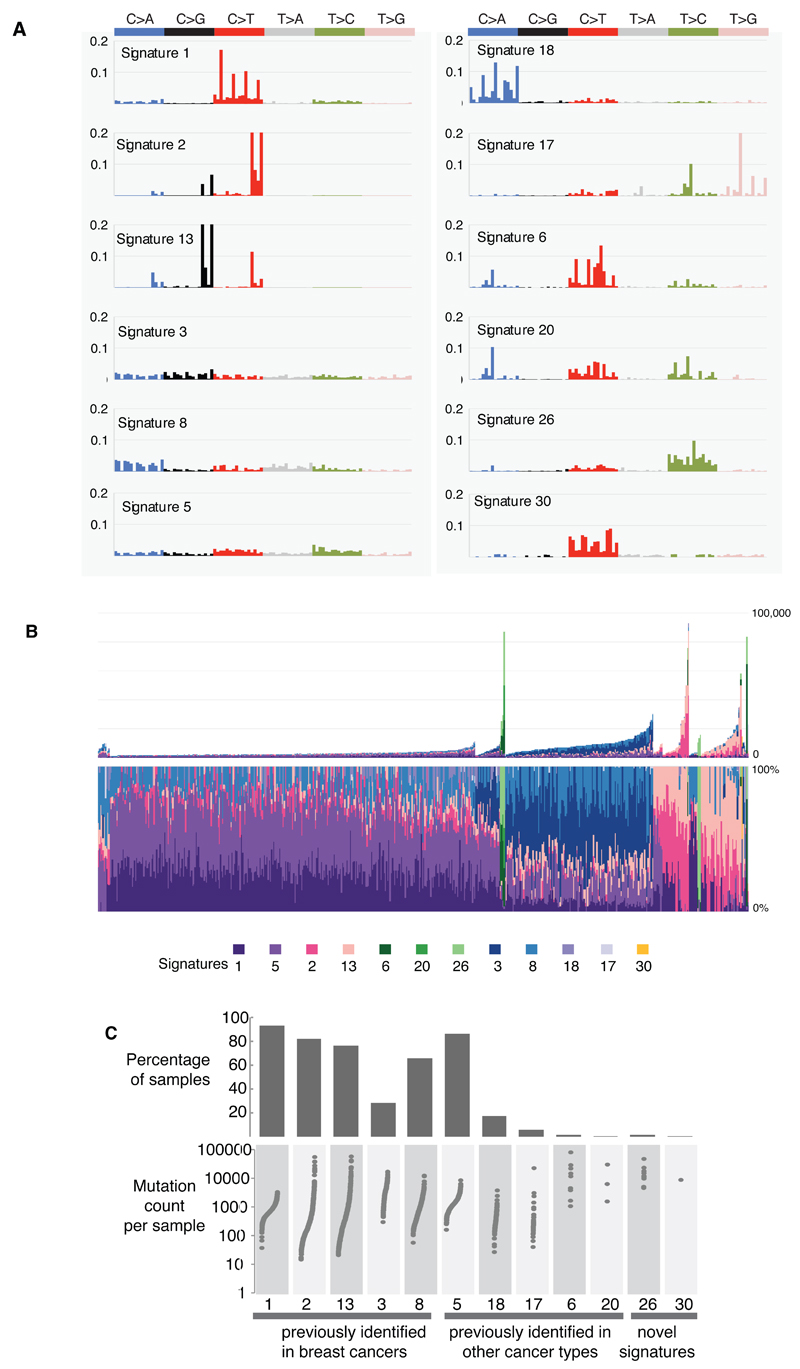
Figure 3. Extraction and contributions of base substitution signatures in 560 breast cancers.
(A) Twelve mutation signatures extracted using Non-Negative Matrix Factorization. Each signature is ordered by mutation class (C>A/G>T, C>G/G>C, C>T/G>A, T>A/A>T, T>C/A>G, T>G/A>C), taking immediate flanking sequence into account. For each class, mutations are ordered by 5’ base (A,C,G,T) first before 3’ base (A,C,G,T).
(B) The spectrum of base substitution signatures within 560 breast cancers. Mutation signatures are ordered (and coloured) according to broad biological groups: Signatures 1 and 5 are correlated with age of diagnosis, Signatures 2 and 13 are putatively APOBEC-related, Signatures 6, 20 and 26 are associated with MMR deficiency, Signatures 3 and 8 are associated with HR deficiency, Signatures 18, 17 and 30 have unknown etiology. For ease of reading, this arrangement is adopted for the rest of the manuscript. Samples are ordered according to hierarchical clustering performed on mutation signatures. Top panel shows absolute numbers of mutations of each signature in each sample. Lower panel shows proportion of each signature in each sample.
(C) Distribution of mutation counts for each signature in relevant breast cancer samples. Percentage of samples carrying each signature provided above each signature.

