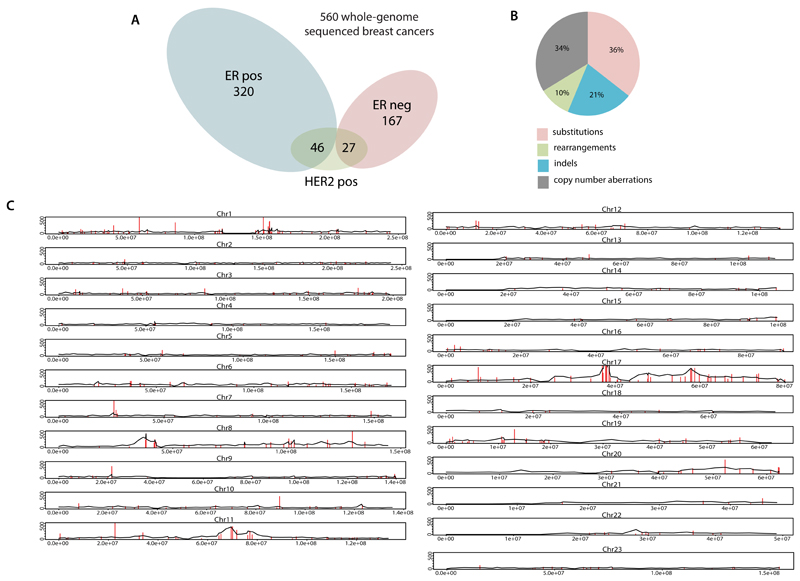
Extended Data Figure 1. Landscape of driver mutations.
(A) Summary of subtypes of cohort of 560 breast cancers
(B) Driver mutations by mutation type
(C) Distribution of rearrangements throughout the genome. Black line represents background rearrangement density (calculation based on rearrangement breakpoints in intergenic regions only). Red lines represent frequency of rearrangement within breast cancer genes.

