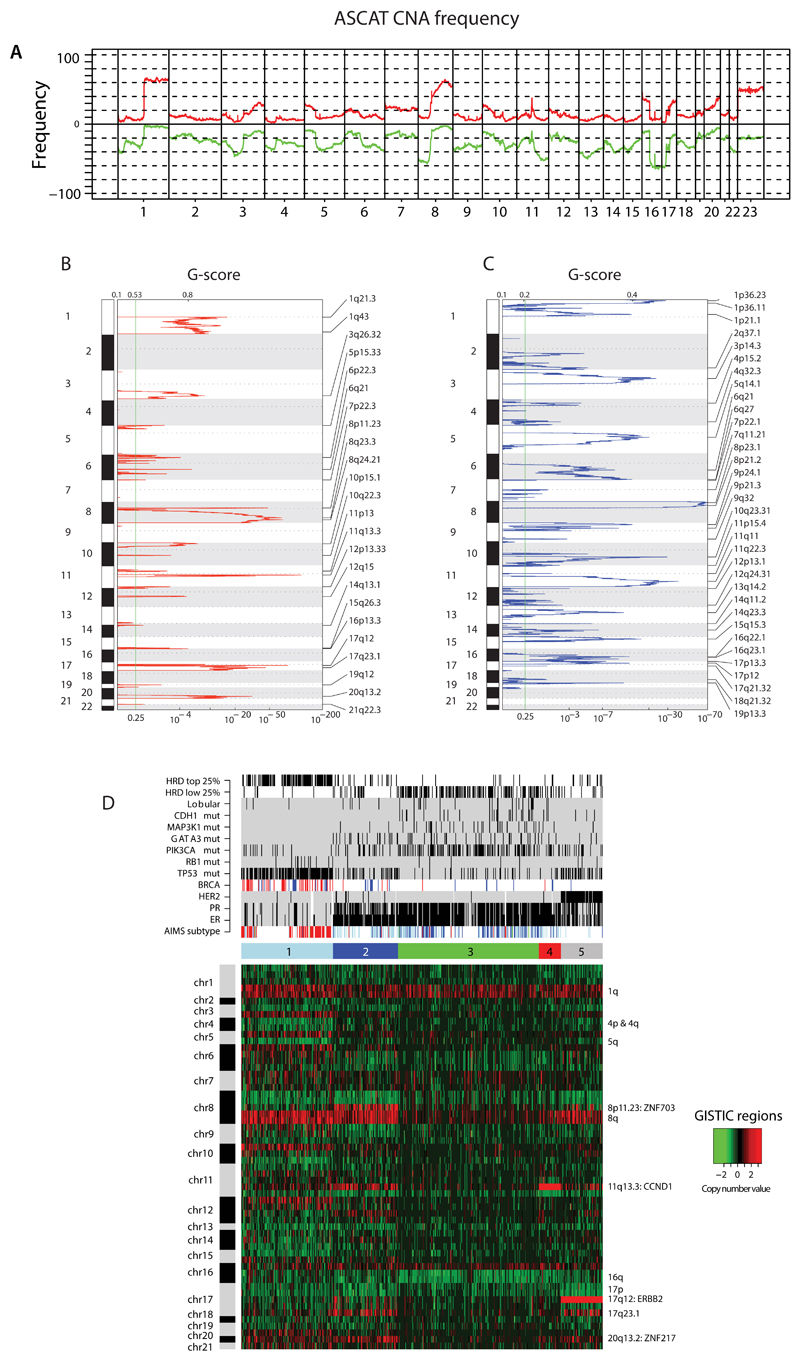
Extended Data Figure 4. Copy number analyses.
(A) Frequency of copy number aberrations across the cohort. Chromosome position along x-axis, frequency of copy number gains (red) and losses (green) y-axis.
(B) Identification of focal recurrent copy number gains by the GISTIC method (Supplementary Methods)
(C) Identification of focal recurrent copy number losses by the GISTIC method
(D) Heatmap of GISTIC regions following unsupervised hierarchical clustering. 5 cluster groups are noted and relationships with expression subtype (basal=red, luminal B=light blue, luminal A=dark blue), immunohistopathology status (ER, PR, HER2 status – black=positive), abrogation of BRCA1 (red) and BRCA2 (blue) (whether germline, somatic or through promoter hypermethylation), driver mutations (black=positive), HRD index (top 25% or lowest 25% - black=positive).

