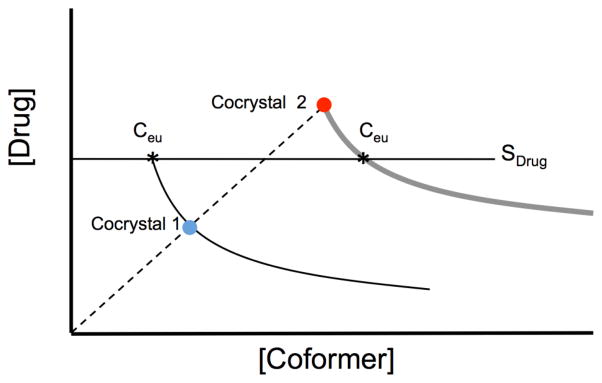
Fig. 32.
Schematic phase solubility diagram indicating the eutectic points (*) where cocrystal and drug solid are in equilibrium with solution [4]. Ceu represents the eutectic concentrations of drug and coformer. Two different cocrystals are considered based on their stability with respect to drug under stoichiometric conditions: a stable cocrystal (cocrystal 1) and metastable (cocrystal 2) where cocrystal generates supersaturation with respect to drug. Drug solubility is indicated and is much lower than the solubility of the coformer, which is not shown. Circles represent the solubility of cocrystals in pure solvent. Dashed line illustrates stoichiometric concentrations of cocrystal components which dissolution could follow. This line represents a drug to coformer ratio equal to the cocrystal stoichiometric ratio of the components. Adapted with permission from D. J. Good and N. Rodríguez-Hornedo from ref. [4]. Copyright 2009 American Chemical Society.

