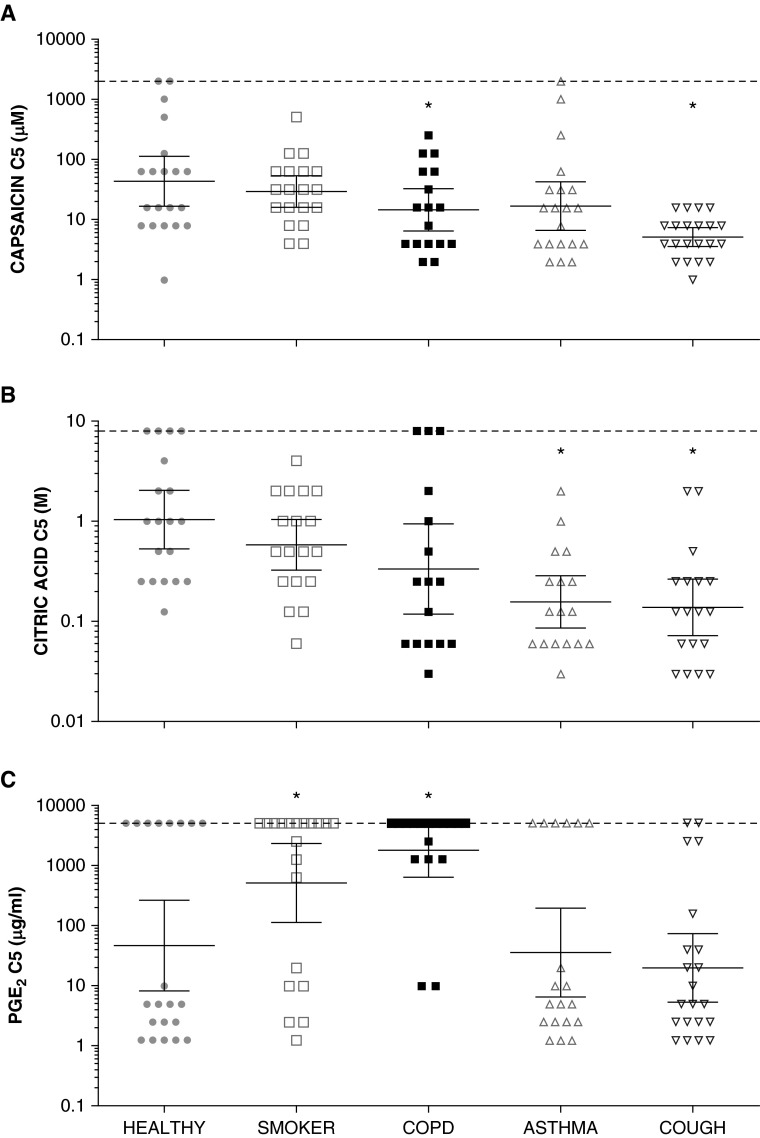
Figure 1.
(A–C) Cough reflex sensitivity to tussive agents in airway diseases compared with healthy control subjects. Concentrations of tussive agents causing at least five coughs for all patient groups (C5). The lower the C5, the greater the sensitivity of the cough reflex. Note the logarithmic scale on the y-axes. Horizontal lines and error bars represent mean values and 95% confidence intervals. Asterisks denote significant differences compared with healthy control group (P < 0.05, analysis of variance). COPD = chronic obstructive pulmonary disease; PGE2 = prostaglandin E2.

