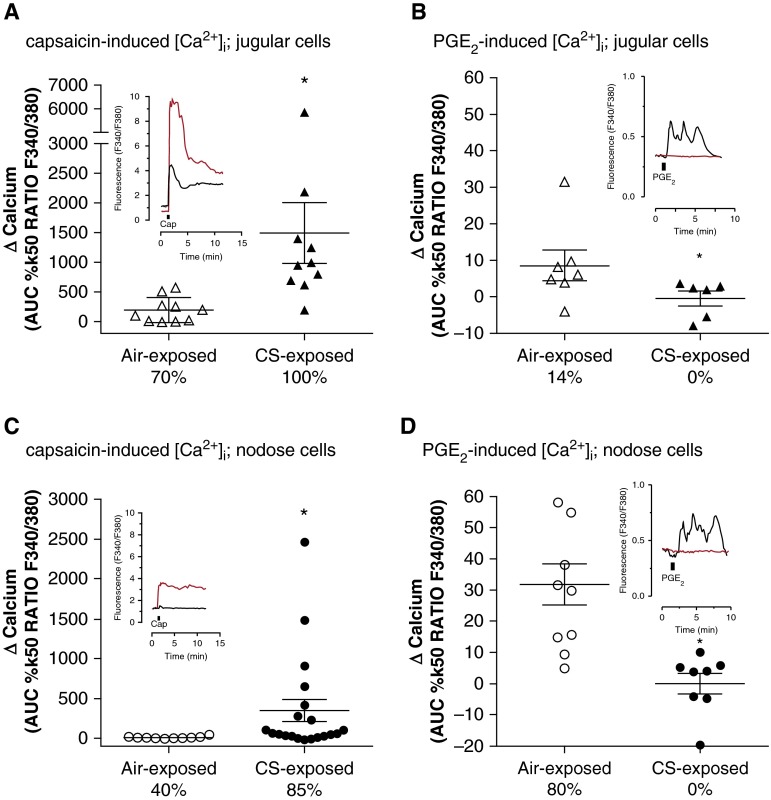
Figure 4.
[Ca2+]i flux in guinea pig airway-terminating vagal ganglia neurons. Intracellular calcium increases induced by (A and C) capsaicin or (B and D) prostaglandin E2 (PGE2) in isolated airway-terminating (A and B) jugular or (C and D) nodose ganglia neurons taken from guinea pigs exposed to either air (open symbols) or cigarette smoke (CS; solid symbols) for 8 days. The percentage displayed denotes the proportion of neurons recorded from where the responses of the Δ[Ca2+]i was at least 10% of the internal control response. Data are presented as the mean ± SE; note different y-axis scales for [Ca2+]i flux with capsaicin application (A and C). *P < 0.05 as determined by Mann-Whitney U test. Representative traces (F340/F380 ratio, y-axis scale) of the data in each panel are shown in the respective inset graphs. These representative traces show [Ca2+]i recorded with Fura2 for airway neurons from air- (black line) or CS-exposed (red line) guinea pigs, where application of either capsaicin (1 μM) or PGE2 (10 μM) is indicated by the black bar. AUC = area under the curve.

