Figure 2.
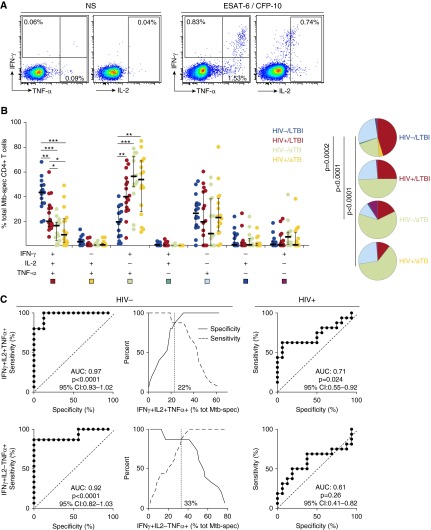
Comparison of the polyfunctional profile of early secretory antigenic target-6 (ESAT-6)/culture filtrate protein-10 (CFP-10)–specific CD4+ T cells between HIV-uninfected and HIV-infected individuals with latent tuberculosis infection (LTBI) or active tuberculosis (aTB). (A) Representative dot plots of IFN-γ, tumor necrosis factor (TNF)-α, and IL-2 production in response to ESAT-6/CFP-10 peptide pool in one LTBI/HIV− individual. NS = no stimulation. Numbers represent the frequencies of cytokine-producing cells expressed as a percentage of the total CD4+ T-cell population. (B) Proportion of Mycobacterium tuberculosis (Mtb)-specific CD4+ T cells producing any possible combinations of IFN-γ, TNF-α, or IL-2. Horizontal bars represent the median values and interquartile range. Statistical analysis was performed using Mann-Whitney test; significant differences are indicated by asterisks (***P < 0.001, **P < 0.01, *P < 0.05). Each slice of the pie corresponds to a distinct combination of cytokine. A key to colors used in the pie charts is shown at the bottom of the graph. (C) Receiver operating characteristic curves and specificity/sensitivity crossover plots for the proportion of IFN-γ+ IL-2+ TNF-α+ (top), and IFN-γ+ IL-2−TNF-α+ (bottom) Mtb-specific CD4+ T cells to discriminate between LTBI or aTB in HIV-uninfected and HIV-infected individuals. The diagonal dashed line depicts an area under the curve (AUC) of 0.5, representing a random test. The dashed vertical line on the crossover plots represents the optimal threshold to distinguish LTBI and aTB individuals. CI = confidence interval.

