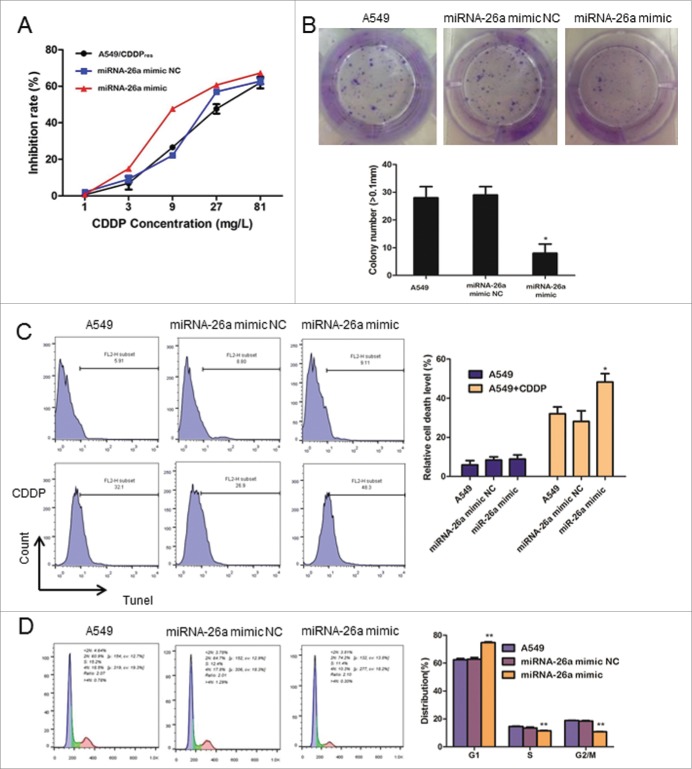
Figure 4.
miR-26a overexpression reduces CDDP resistance in NSCLC. (A) Drug sensitivity assays revealed that upregulation of miR-26a decrease IC50 of A549/CDDPres to CDDP. (B) Representative micrographs and quantification of crystal violet stained cell colonies. (C) Flow cytometric analysis for TUNEL assay of A549 cells transfected with NC or miR-26a mimics. Each bar represents the mean of 3 independent experiments. (D) Cell cycle analysis of A549 cells transfected with NC or miR-26a mimics. Each bar represents the mean of 3 independent experiments. * P< 0.05.

