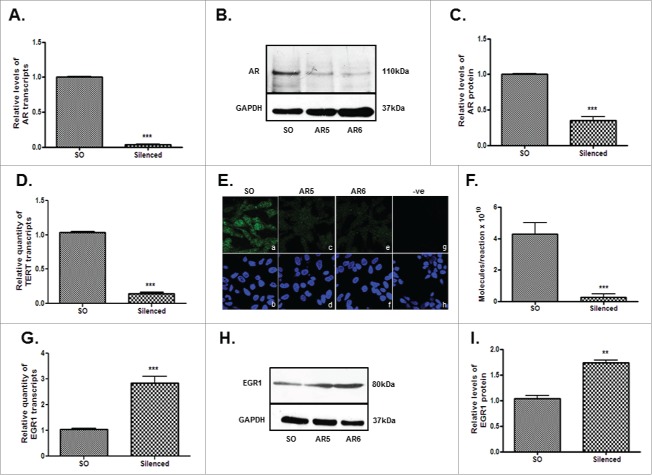
Figure 4.
Effect of AR silencing on hTERT and EGR-1 expression in androgen-dependent LNCaP cells. AR5 and AR6 siRNAs target 2 different regions of AR. Panels A-C display the levels of AR transcripts (A) and protein (B, C) in the AR silenced cells. Panels D-F demonstrate the levels of hTERT transcripts (D), protein (E) and telomerase activity (F) in AR-silenced cells. Panel E shows detection of immunoreactive hTERT in the SO-transfected (a), AR5-silenced (c) and AR6-silenced (e) cells. Panel g shows cells stained only with secondary antibody. Lower panels - b, d, f and h are the counterstained (DAPI) images of the cells shown in panels a, c, e and h, respectively. Panels G-I show the effect of AR silencing on the levels of EGR1 transcripts (G) and protein (H, I). Panels C and I represent densitometric analysis of the immunoreactive bands (AR or EGR1) in the SO and AR (AR6) siRNA transfected cells. ** p value < 0.01, *** p value < 0.001, **** p value < 0.0001.

