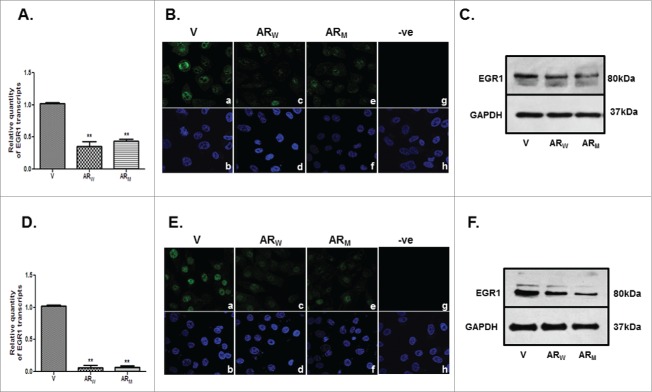
Figure 7.
Relative levels of EGR1 transcript and protein in PC3 (A,B,C) and DU145 (D,E,F) cells, transfected with AR cDNA (ARW/ARM) or empty vector (V) constructs; as assessed by qRT-PCR (A,D), immunofluorescence (B,E) and immunoblotting (C,F). B and E represent immunofluorescent detection of EGR1 in PC3 (B) and DU145 (E) cells transfected with empty vector (a) or AR cDNA constructs (c, e). Panels g in B and E show cells stained only with secondary antibody. Lower panels -b, d, f and h are the DAPI stained images of the cells shown in panels a, c, e and g, respectively. Magnification-63X. ** p value < 0.01.

