Figure 1.

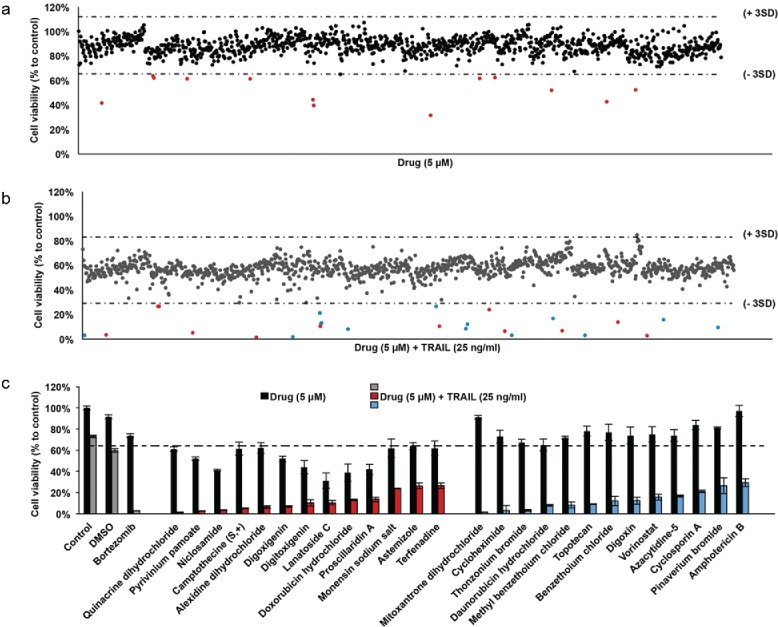
Screening of FDA-approved drugs for TRAIL-sensitizers in GBM cells (A) Scatter plot of U87MG cell viability upon 24 hours of treatment with drug library composed of 1200 compounds. Each dot represents the percent cell viability compared to untreated control samples. Horizontal dashed lines depict the range of viability within 3 SD of the mean viability (64 % and 112%). Red dots are drugs that have significant effect on cell viability as single agents. (B) Scatter plot of U87MG cell viability upon 24 hours of treatment with drug library composed of 1200 compounds and TRAIL together. Each dot represents the combinatorial effect of the individual drug (5 µM) and TRAIL (25 ng/ml) on cell viability compared to untreated control samples. Horizontal dashed lines depict the range of viability within 3 SD of the mean viability (29% and 83%). Red and blue dots indicate the combination effect below the threshold of 3 SD from the mean cell viability. (C) Top 26 hits were determined via cut off value of 29% cell viability after drug and TRAIL addition. DMSO and Bortezomib, negative and positive control respectively, are indicated in gray bars. The effect of drug and TRAIL are grouped among hits, as drugs with significant effect on cell viability as single agents (red bars) and the others (blue bars). Error bars represent “mean ± NSEM.” SD: standard deviation from mean cell viability.
