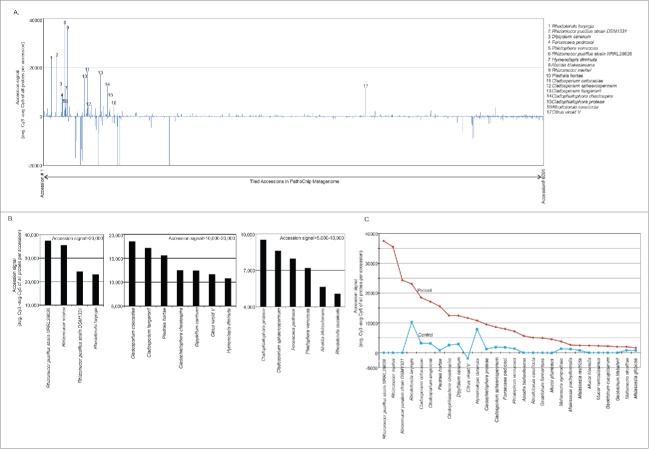
Figure 1.
Accession analysis of samples screened by PathoChip. Figure A shows the accession signal (average Cy3 signal for probes-average Cy5 signal for probes/accession) of 6001 accesions of PathoChip metagenome, represented as bar graph. The organisms showing high accession signal (>5000) are numbered. Figure B shows the top hit accessions detected in the patient sample in decreasing order of accesion signals. Figure C represents the comparative accesion signals in cancer versus the control.

