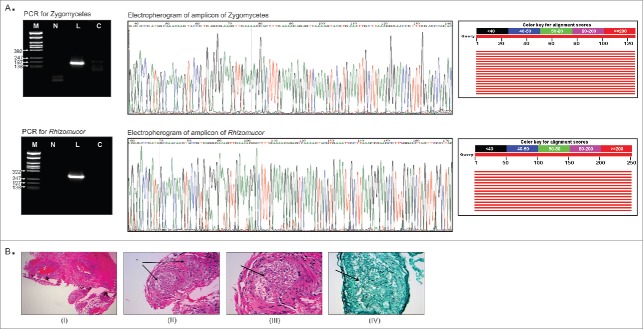
Figure 3.
Validation of PathoChip screen results by PCR, sequencing and staining of infected tissue section. Fig. 3A shows the the PCR amplified products yielded using primers to detect any Zygomycetes fungi and primers to detect Rhizomucor, run on 2% agarose gel (left panel). Ethidium bromide stained gel picture of the amplicons are shown (left panel). M: φX174/Rsa1 DNA ladder, L: leukemic patient sample, C: control sample. Part of the electropherogram of the ampilcons sequenced is shown (middle panel). The NCBI BLAST tool showed alignement scores for each amplicon sequenced (right panel). The graphic summary shows alignments (as colored lines) of database matches to the amplicons sequenced (query). The red color lines represented the highest alignment scores, thus suggesting the query sequence to be significantly similar to the database hit Rhizomucor pusillus and Rhizomucor miehei 28S rRNA sequences. Fig. 3B shows the staining of tissue section from the patient for fungus. A Hematoxylin and Eosin (I-III) as well as Grocott Methanamine Silver (IV) stain were performed on the tissue sections from the paravertebral mass of the patient. Figure (I) shows the low power view of the soft tissue, (II) shows the 20X view, (III) shows the 40X view and (IV) shows the 40X view using silver stain (Grocott stain). Fungus in blood vessels is shown with arrows.

