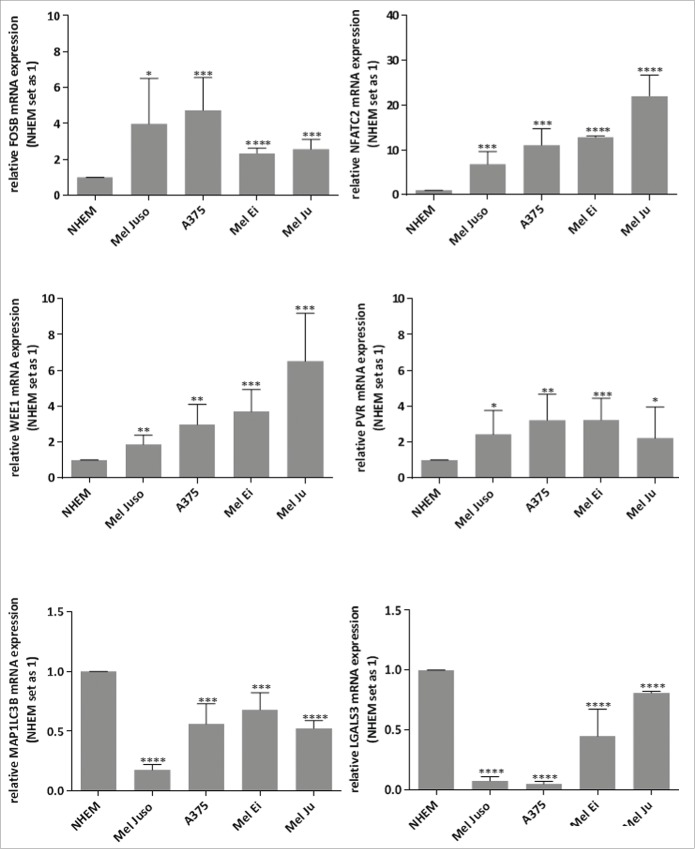
Figure 4.
Relative FosB, NFATC2, WEE1, PVR, LGALS3 and MAP1LC3B mRNA expressions in melanoma cell lines. qRT–PCR of FosB, NFATC2, WEE1, PVR, LGALS3 and MAP1LC3B in 4 different melanoma cell lines shows up-regulation of FosB, NFATC2, WEE1 and PVR and down-regulation of LGALS3 and MAP1LC3B compared to in NHEMs. The bars indicates the means ± s.d. of three independent experiments; measurements were performed in triplicate (****P < 0.0001; ***P < 0.001; **P < 0.01; *P < 0.5).

