Figure 3.

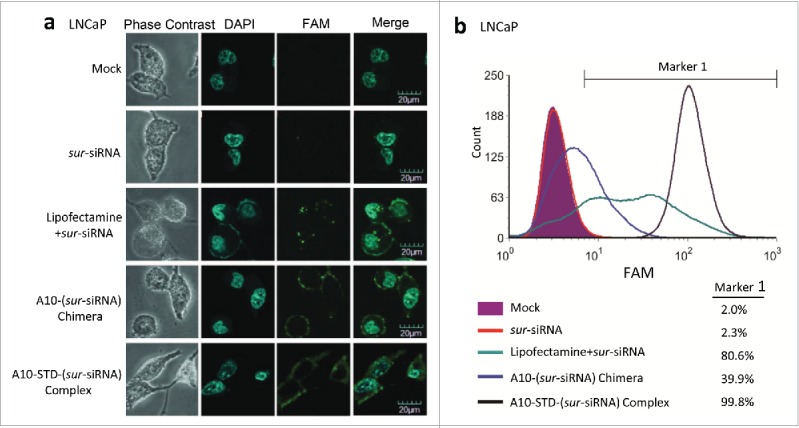
TAT mediates efficient delivery of siRNA into LNCaP cells. (a) CLSM analysis of the location of siRNA. FAM labeled sur-siRNA was shown in green fluorescence. Phase contrast channel (gray) and the nuclei stained with DAPI (blue) was used to show the position of LNCaP cells. Channels were merged to co-locate the position of sur-siRNA in LNCaP cells. Scale bar = 20 μm. (b) Flow Cytometry analysis of transfection efficiency of sur-siRNA into LNCaP cells corresponding to (a). Unstained cells are shown in purple. The complex group was showed with black lines. Free sur-siRNA (red line) was set as negative control, while the lipofectamine (blue line) and chimera (green line) groups were set as positive control. Marker 1 was used to cover FAM positive cells by defining unstained cells as negative, allowing for a maximum coverage of unstained cells of 2%. The percentage of fluorescence positive cells covered by Marker 1 was showed on the right of (b).
