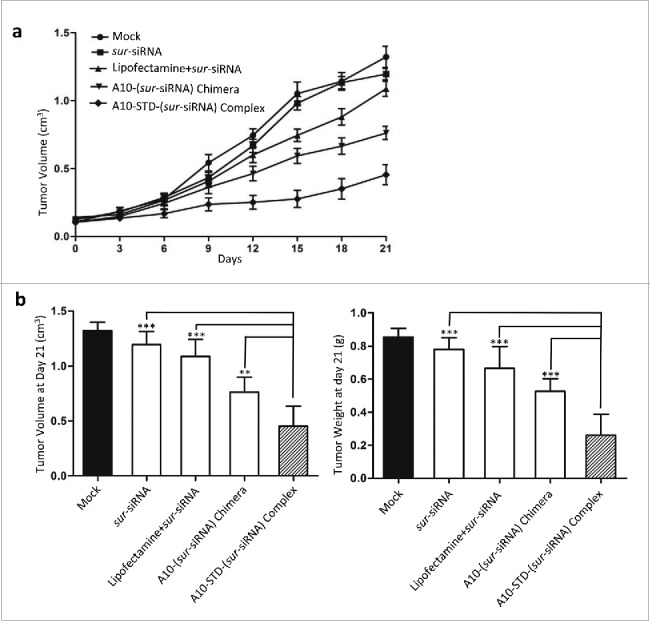
Figure 5.

Tumor growth suppression effect of the complex. (a) Tumor Growth Curve analysis of the suppression effect of the therapeutic complex. Tumor growth curve was drawn by tumor volume of mice in each group at 8 time points (every 3 day after the first injection). Data represent Mean +/− SEM of at least 3 separate measurements. The diagram of each group was showed above the curves. (b) On day 21 mice were killed and LNCaP tumors were incised. Mean ± SEM of tumor volume (left graph) and weight (right graph) were measured and showed in histogram. Comparison was between the complex group and negative control group (free sur-siRNA) or the other 2 positive control groups (lipofectamine and chimera). ***: P < 0.0001; **: P < 0.001; *: P < 0.01. The complex group n = 6, other groups n = 8.
