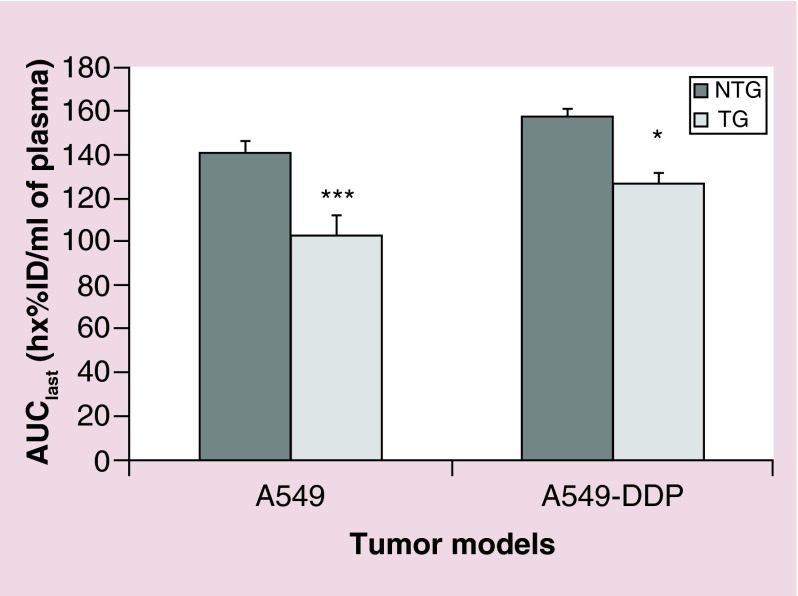
Figure 3. . Plasma exposure to siMad2 over the duration of the study.
AUClast +SE (in h*%ID/ml of plasma) for A549-WT and A549-DDP tumor models, after IV injection of NTG and TG nanoparticles at 3 mg/kg equivalent siRNA.
n = 5 mice.
*p < 0.05; **p < 0.01; ***p < 0.001 (t-test TG vs NTG).
AUClast: Area under the concentration versus time curve until the last time point; DDP: Cisplatin; NTG: Nontargeted; SE: Standard error; TG: Targeted; WT: Wild-type.

