
Fig 5. The average standard error (S%) in the estimate of total AGB of 30 selected trees.
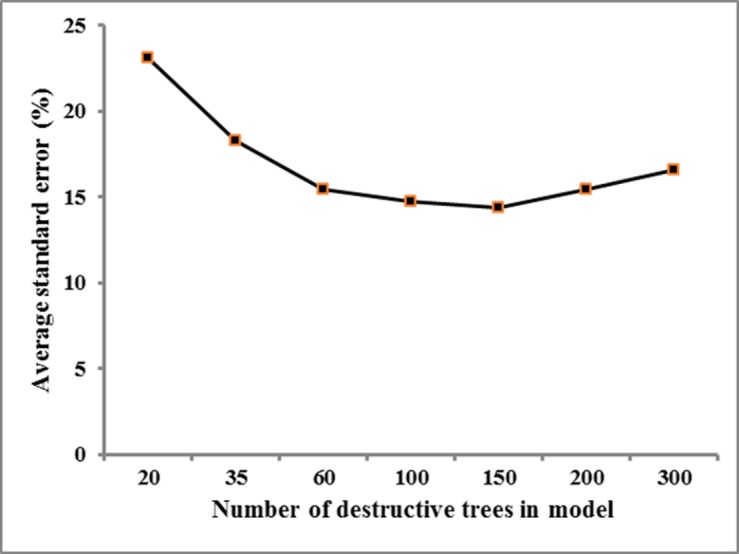
Each square was the average standard error (S%) of the estimate (Y axis) given by the model that was developed by a certain number of destructive trees i.e., 20, 35, 60, … and 300 trees, respectively (X axis).