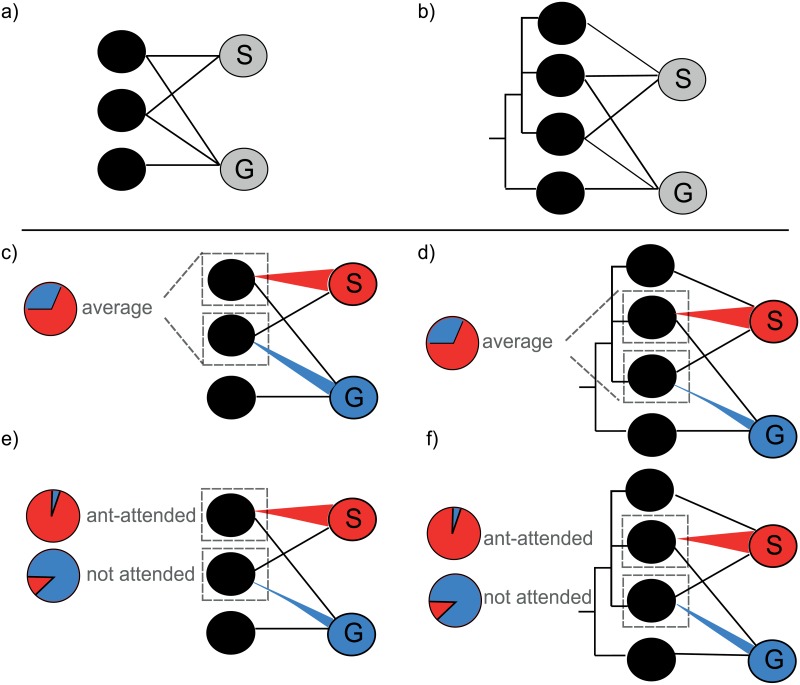
Fig 1.
Specialist-generalist trade-off calculated using two measures of parasitoid specialization based on the number (a) and taxonomic diversity (b) of species in the host range. Upper panel illustrates the difference between two measures of host specialization and the lower panel illustrates theoretical expectations for our analysis. For pairs of parasitoids, the proportional abundance of the relative specialist (red, “S”) and generalist (blue, “G”) on the shared hosts is compared. Proportion of specialists can be measured across all shared hosts (c, d, see also [5]) or dependent on the host traits (e, f, our study). Black circles present different host species and the width of the red and blue links presents frequency of aphid-parasitoid interactions. Dashed squares highlight shared hosts, for which pie charts indicate the proportional abundance of relative specialists and generalists.

