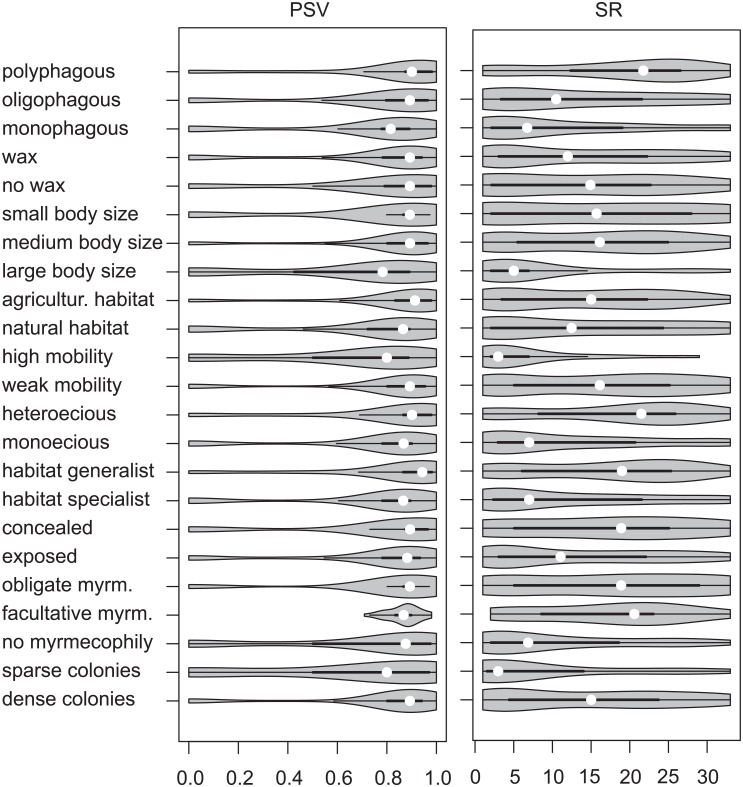
Fig 2. Violin plots presenting distribution of average weighted specialization of parasitoid assemblages per aphid trait.
The median value for each aphid trait is shown by the white circle and the length of the thick black line represents the interquartile range. Parasitoid specialization is measured as species richness (SR) or phylogenetic diversity of the hosts (PSV).

