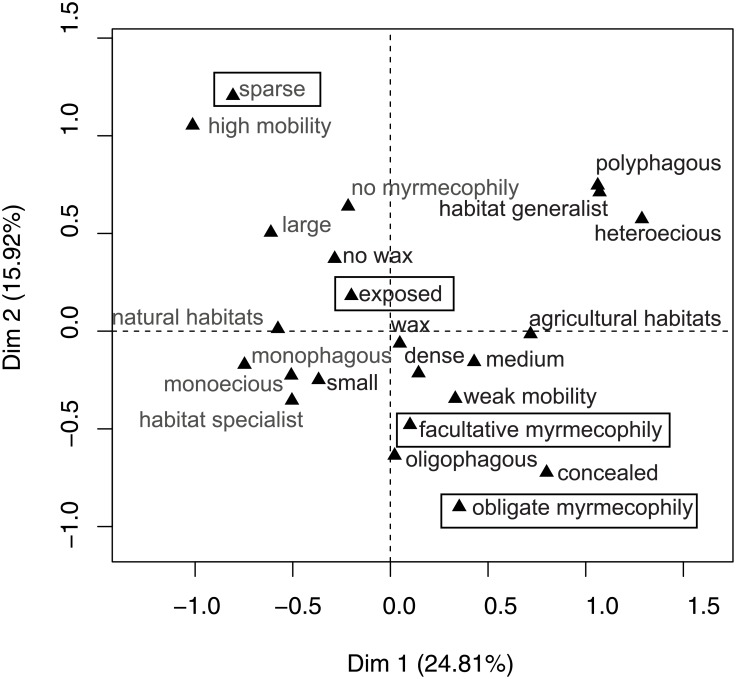
Fig 3. The first two principal axes (Dim1 and Dim2 with percentage of variance) and the cloud of categories as a result of MCA (Multiple correspondence analysis) on the aphid species × aphid traits matrix.
Trait levels that are close together tend to be associated in aphids. Framed labels present trait levels which supported a higher proportion of relative specialists (specialist advantage). Gray labels present traits levels that supported higher average specialization of parasitoid assemblages. See the text for explanation of the traits and trait levels.

