
Fig. 1. High Env-specific IgA (IgA) levels are associated with increased risk of HIV-1 acquisition only in the presence of HLA-DQB1*06.
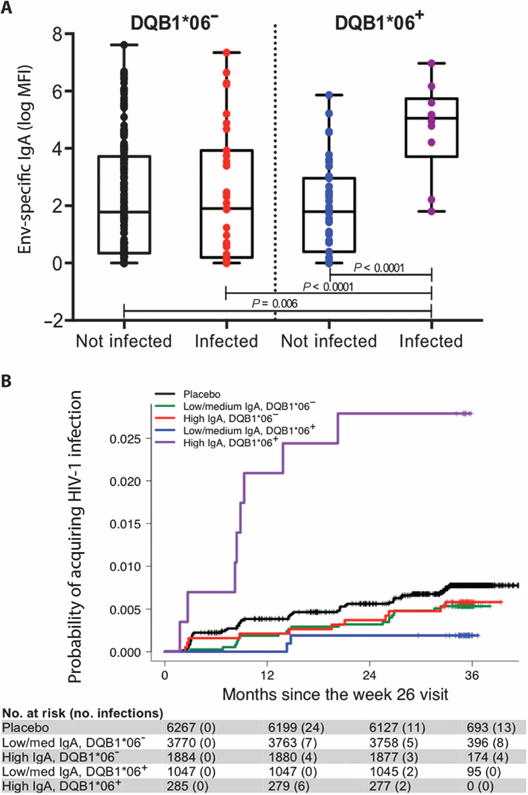
(A) Box plots of vaccinated individuals stratified according to HIV-1 infection status and the absence or presence of DQB1*06. Individual data points are indicated by colored circles within the box plots showing the 25th (bottom edge of the box), 50th (horizontal line in the box), and 75th percentiles (top edge of the box). Analysis of variance tested IgA distributions across subsets with differences further interrogated using Bonferroni-adjusted t tests. MFI, mean fluorescence intensity. (B) Estimated cumulative HIV-1 incidence curves for individuals stratified by IgA and DQB1*06 for the entire vaccinated RV144 cohort. Vaccinated individuals in the case-control study are stratified into subgroups according to their IgA responses (low/medium and high, corresponding to the lower two-thirds and upper one-third of responses) at week 26 and the absence or presence of DQB1*06. Individual curves represent the estimated cumulative incidence of HIV-1 infection over time since the measurement of IgA at week 26. Curves were estimated using the Kaplan-Meier method with inverse probability weighting accounting for the sampling design.