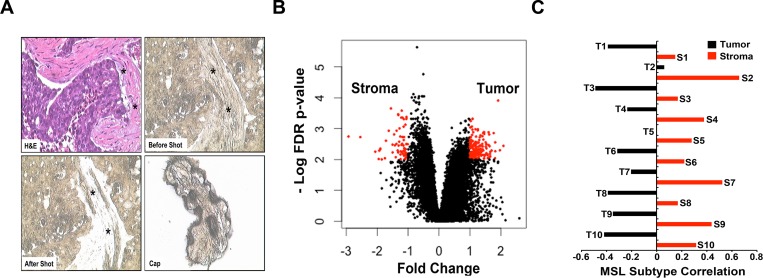
Fig 2. LCM followed by gene expression analysis of tumor epithelium and adjacent stroma identifies normal stromal cell gene expression in the MSL TNBC subtype.
(A) Representative images of H&E (upper left), tissue before (upper right) and after (lower left) LCM and cells isolated (lower right) for gene expression analysis in adjacent tumor stroma (asterisk). (B) Scatter-plot shows differentially expressed genes (FC> 2, FDR< 0.01) between LCM-isolated tumor epithelium and stromal cells from 10 TNBC tumors. (C) Bar-plot shows the correlation of each tumor epithelial and stromal pairs to the MSL subtype.

