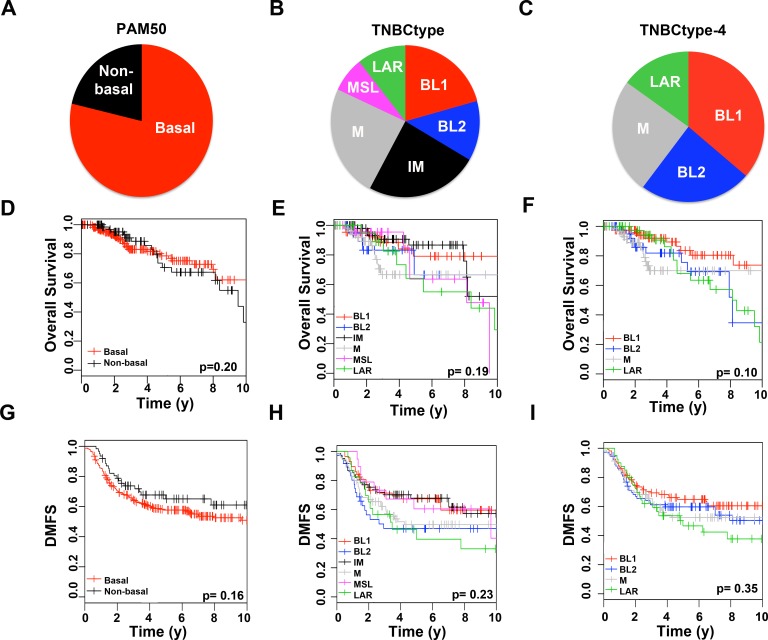
Fig 3. Molecular subtype distribution and survival analysis of TNBC samples stratified by PAM50, TNBCtype or refined TNBCtype-4.
Piecharts show the distribution of 767 TNBC samples by (A) PAM50 (B) TNBCtype or (C) refined TNBCtype-4. Kaplan-Meier curves show overall survival for TNBC patients stratified by (D) PAM50 (E) TNBCtype or (F) refined TNBCtype-4 or relapse-free survival stratified by (G) PAM50 (H) TNBCtype or (I) refined TNBCtype-4. P-values shown were determined by logrank test. * indicates significant (p<0.05) pairwise survival differences between a subtype and all other subtypes combined not adjusted for multiple comparisons.

